Global Monthly - Global industry recovering amid disturbances, excess supply and trade spats

Despite shipping disturbances, and trade spats, global trade and industry are bottoming out. Disturbances in the Red Sea and the Panama Canal have impacted global shipping routes, while escalation in the Middle East conflict reminds us of the ever-present risk of new supply shocks. However, the global macro impact of disturbances so far is fading and looks manageable. What about overcapacity? Supply side strength is contributing to global goods disinflation, but China’s role in this is leading to trade spats – electric vehicles being a clear case in point.
Global View: Trade and industry is recovering, despite the risks and the tensions
Financial markets have had a rude awakening over the past month. First, fears reignited that US inflation may be making a comeback following the third upside surprise in a row in the March CPI data. This drove a resumption in the repricing of Fed rate cuts, and financial markets moved away from the long-held view that the ECB and the Fed are on exactly the same rate cutting path. Indeed, the first fully priced rate cut by the Fed is now not until November, whereas markets still price a high probability that the ECB will start lowering rates in June. This month, we significantly raised our GDP growth forecast for the US, reflecting the ongoing resilience on the other side of the Atlantic. Despite the recent upside surprise to the US inflation data, however, our outlook for inflation remains fundamentally unchanged, as pipeline pressures in the US continue to suggest the recent high readings are likely not durable. Still, solid US growth reduces the urgency for rate cuts – in contrast to the stagnation that we continue to see in the eurozone. For this reason we also now forecast that the ECB and the Fed’s policy paths will diverge somewhat in the near-term, with the ECB expected to lower rates at a faster pace than the Fed, before the two converge again next year as the Fed regains confidence in the US inflation outlook. Meanwhile, the escalation of the conflict in the Middle East reminded us – and financial markets – of the potential for supply shocks to impact the inflation outlook. With tensions easing again recently, our oil price – and in turn our inflation – forecasts unchanged, but the risk of a renewed escalation lurks in the background. Against this backdrop, this month we take a closer look at the nascent recovery in global trade and industry, which continues to unfold despite geopolitical disturbances, overcapacity and trade tensions.
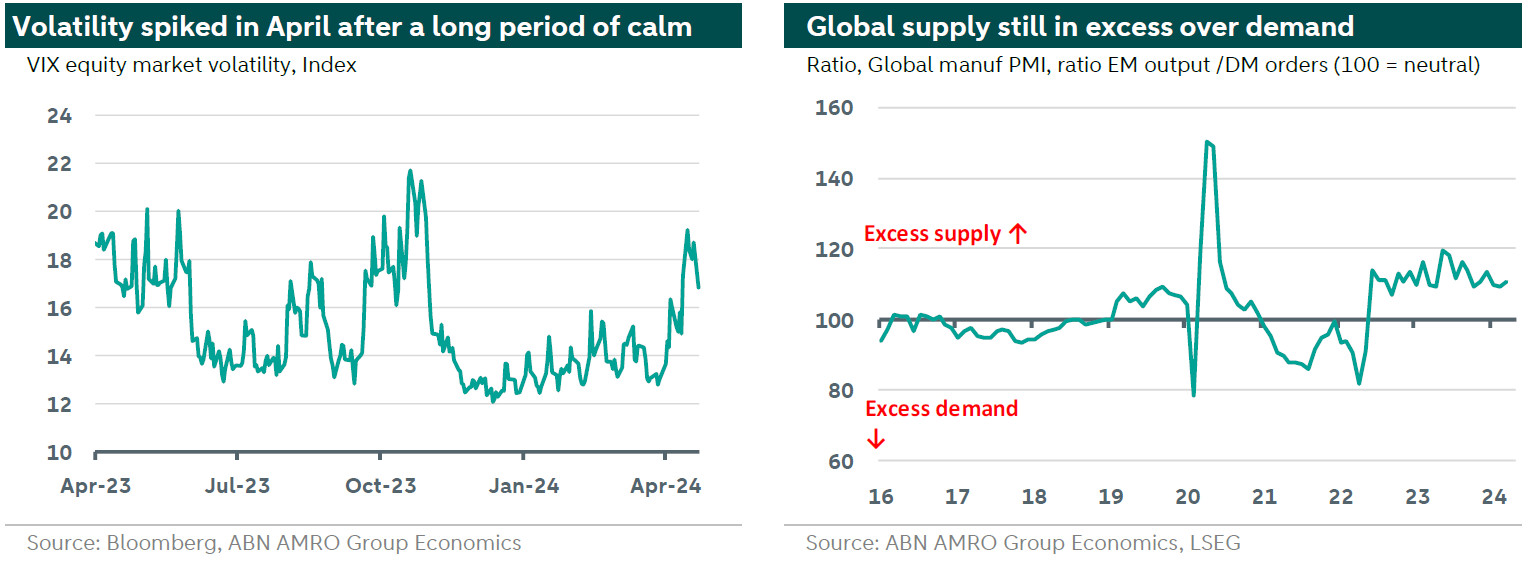
Global trade is bottoming out…
Despite renewed disturbances in global shipping and trade conflicts between key economic powers, global goods trade shows signs of a bottoming out. Although monthly data remain volatile, CPB’s world trade volume index has risen by almost 2% since July 2023, with annual growth turning positive again in January for the first time since March 2023. While these trade data are lagging, a forward-looking confirmation comes from the export component of the global manufacturing PMI. This component rose to a two-year high of 49.6 in March 2024, although remaining just below the neutral mark separating expansion from contraction. The improvements seen in global trade comes after a period of weakness, following the strong rebound after the pandemic years. Global trade slowed sharply since late 2022, staying in ‘recession territory’ for most of 2023 – in line with the slowdown of global GDP growth, following the sharp monetary tightening in the developed economies). Despite the recent pick-up, in January the CPB index was still 2.6% below the peak of September 2022. On an annual basis, world trade contracted by 1.9% in 2023, after having risen by over 10% in 2021 and 3.3% in 2022.
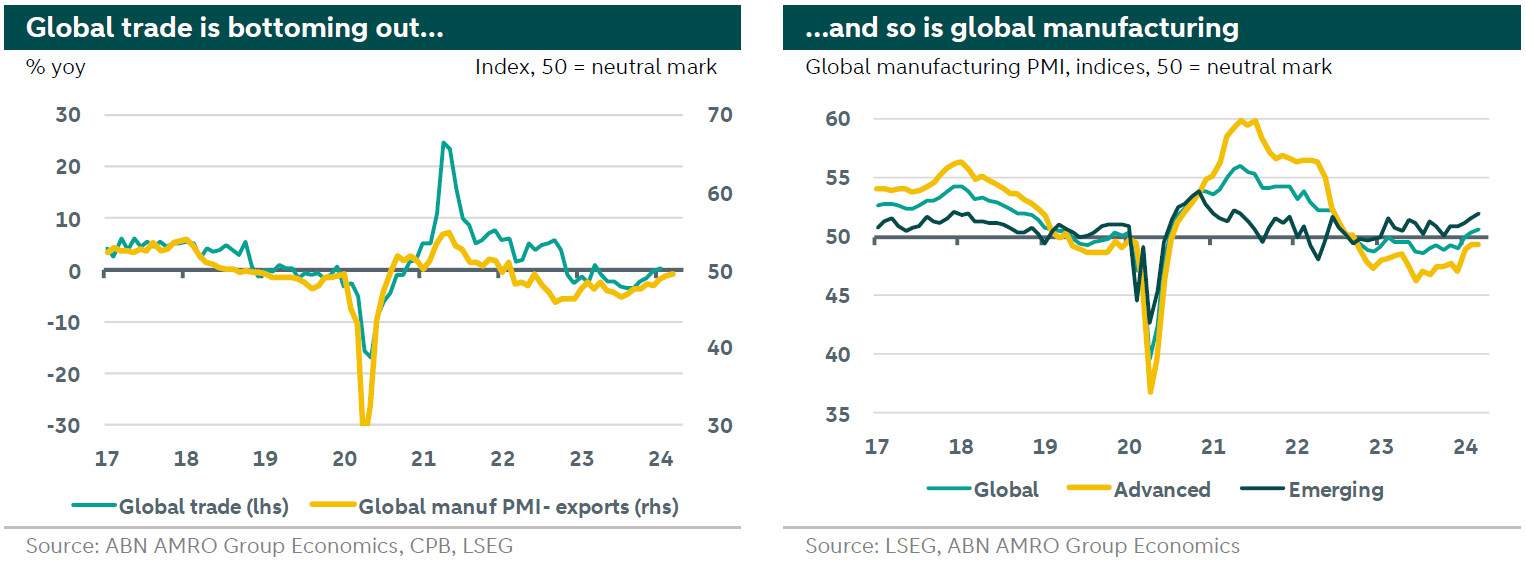
…and so is global manufacturing
Developments in global industry and trade tend to go hand in hand. Global manufacturing has also shown signs of bottoming out in recent months. After having been below the 50 neutral mark since September 2022, the global manufacturing PMI has picked up recently, rising back to above 50 in February/March 2024. There is still quite some divergence, though. Solid industrial growth in emerging economies (led by China) contrasts with ongoing weakness in various developed economies, with manufacturing PMIs still well below 50 for the eurozone (particularly Germany) and Japan. That said, the picture has improved recently for the US and the UK. Recent developments are in line with our expectation of a bottoming out in global industry this year. Given our growth views for the key economies (slowdown in the US, bottoming out in eurozone/China), we still deem a very sharp rebound in global industry – similar to what happened in end 2020/2021 - unlikely at the moment.
While disturbances in the Middle East/Panama Canal impact global shipping routes…
Over the past few months, disturbances in global shipping brought back memories to the pandemic. Houthi attacks on ships passing the Red Sea have sharply impacted global shipping routes. Crossings through the Suez Canal, normally accounting for ±12% of global maritime trade, have dropped sharply, with ships from Asia destined for Europe taking the approximately 10 days longer route via Cape the Good Hope instead. And drought-related low-water levels have impacted crossings through the Panama Canal (used in traffic between Asia and the Americas, in normal times accounting for 3% of global maritime trade). The drought, exacerbated by the El Niño weather phenomenon, is expected to last until May this year. New risks to global shipping routes stem from the escalation between Israel and Iran, with the Strait of Hormuz – through which 20% of oil and related products and LNG from Qatar are transported – being an important potential chokepoint (also see above and our recent Oil market update here).
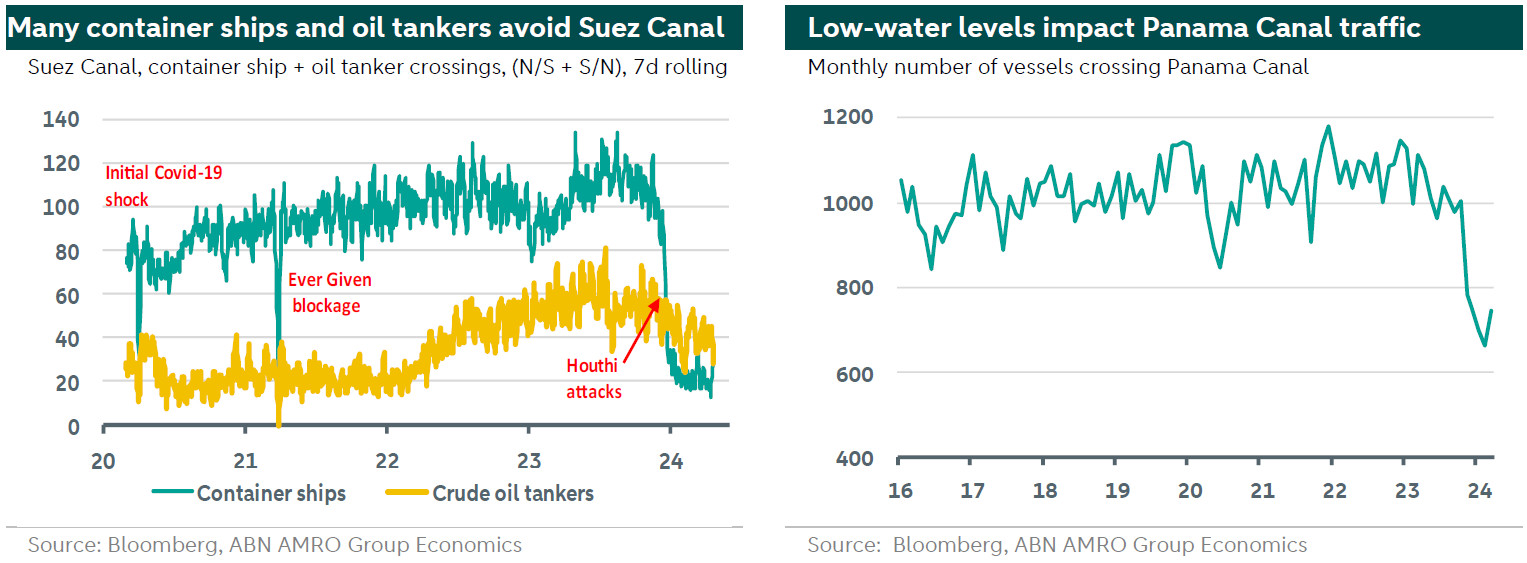
…the global macro impact thereof looks manageable so far and is already fading
Although these disturbances have had large effects on shipping routes, we think the impact on the global economy/global industry and global inflation is manageable and already fading (also see our January Monthly, Will the Red Sea disturbances throw disinflation off track?). This conclusion is in the first place based on the following indicators:
1) Global manufacturing PMI – delivery times component: In the pandemic episode of increased global supply bottlenecks, this component fell to record lows (a drop in the index means longer delivery times). With the disturbances in the Red Sea and the Panama Canal unfolding, this component dropped below the neutral 50 mark in January, but was back again above 50 in February/March. This illustrates that the impact of these disturbances in shipping routes on overall delivery times is not comparable with the effects thereof during the pandemic.
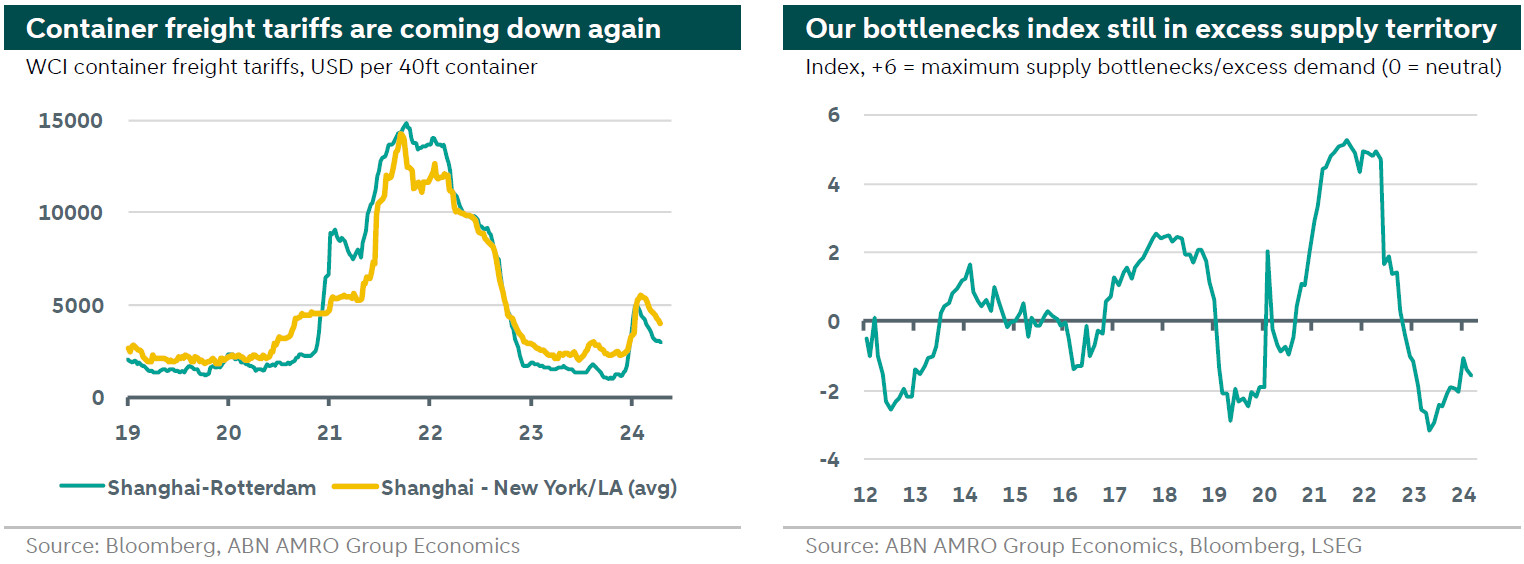
2) Container freight tariffs: During the pandemic years, a combination of supply bottlenecks in global container transport coupled with a strong global demand for goods led to an unprecedented spike in container tariffs. In the course of 2022, these tariffs came down again, with bottlenecks fading and global demand cooling. Following the disturbances in the Red Sea and the Panama Canal, container tariffs started to surge again in December/January, although remaining far below the peaks seen in 2021/2022. And the impact proves short-lived, with container tariffs starting to fall again since late January/early February, helped by a steady increase in global shipping capacity.
Overcapacity? Globally, the supply side is now stronger than the demand side
That the impact of the recent shipping disturbances is now short-lived and modest is a result of 1) the current disturbances being more specific/less broad, and 2) the (global) demand side being now less strong relative to the supply side. Back then, global supply shortages (in goods) were exacerbated by a strong global demand – partly as a result of stimulative monetary and fiscal policies in DMs – and a pandemic-related shift in global demand from services to goods. All of this is also reflected in our global supply bottlenecks index, which captures not only features of global supply bottlenecks (e.g. container tariffs, delivery times), but also global supply-demand imbalances. Our index includes a measure for the global excess of supply/demand. This is the ratio between the EM output component of the global manufacturing PMI – led by China – versus the DM demand components, with DMs seen as typical end-users in global supply chains. Partly reflecting the weakening of demand in DMs in the course of 2022 – on the back of the sharp rise in interest rates following an inflation spike –, this ratio has hovered in ‘excess supply territory’ since (see chart on front page). This has also been an important driver of the turnaround in our bottlenecks index, which has been in ‘excess supply’ territory since end 2022.
…partly driven by developments in China
China also plays an important role in this global supply abundance. Since a couple of years, Beijing has strengthened its focus on bolstering (emerging) high-tech manufacturing industries. This pivot is based on the need to safeguard future productivity growth, become less reliant on the property sector, and increase self-reliance in technology sectors, as the US is leading a tightening of export and investment restrictions on sensitive/strategic tech products. But with domestic production outpacing domestic demand – still constrained for various reasons –, this strategy is leading to overcapacity and higher exports of certain high-tech manufactured products (also see our recent China coverage, Always look at the demand side of life).
Excess supply keeps lid on industrial goods’ prices, but risks from escalation remain
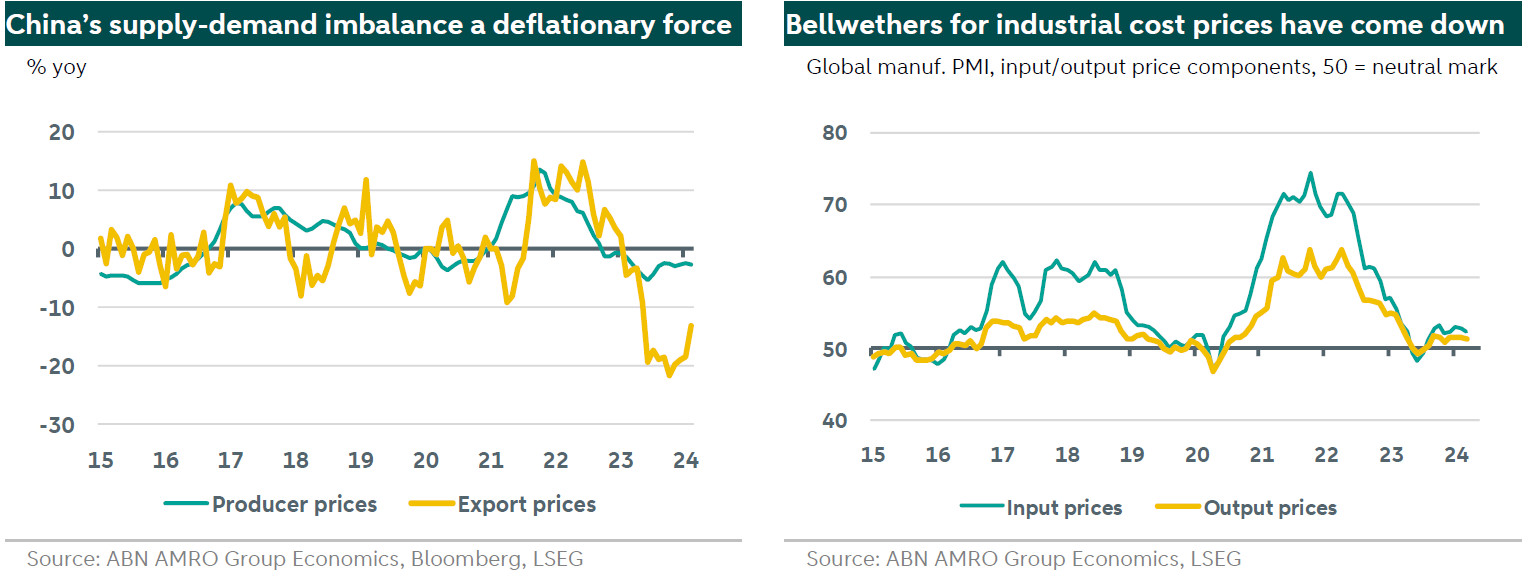
In China, supply dominance over demand is going hand in hand with deflationary pressures – with producer price inflation in negative territory for 17 months now, while export prices have come down sharply. This, and – more broadly – the global supply abundance is keeping a lid on global manufactured goods’ prices. The global manufacturing PMI’s components for input and output prices – bellwethers for global cost push pressures in manufactured goods – have stabilised after a modest pick-up in late 2023, and have come down sharply from the peaks seen in 2021-2022. All of this shields against the (potentially) inflationary impact of the recent disturbances. That said, this could change in a severe escalation scenario, – with for instance rising tensions between Israel and Iran – and in the wider region – triggering a sharper, and more sustained rise in energy prices and container tariffs (also see above and our Oil market update).
China’s excess supply in manufacturing leads to trade spats…
Another important effect of China’s role in the current abundant supply conditions following Beijing’s pivot to high-tech manufacturing is that its adds to (already prevailing) trade tensions with the West. That is particularly true for strategically sensitive high-tech goods – including those needed in the global energy transition –, although China’s excess supply is visible in other sectors as well (including construction-related equipment, also reflecting the drop in domestic demand). The US continues with tightening restrictions on high-tech related investment and strategic exports in/to China under a High Fence, Small Yard strategy. On a recent visit to Beijing, US Treasury Secretary Yellen urged China to scale back its recent surge of green energy technology exports, while focussing on bolstering domestic consumption instead. The US administration will also propose new 25% tariffs on certain steel and aluminum products imported from China. The EU raised concerns about the negative effects of manufacturing overcapacity in China as well (see for instance) and is taking various actions to risk-mitigate the trade and investment relationship with China, including the start of several investigations into Chinese subsididies (e.g. electric vehicles, wind turbines). China has countered the accusations by stating China’s surge in high-tech exports is driven by strong global demand, helps pushing down inflation. and contributes to reaching the climate goals globally.
…with electric vehicles (EVs) being a clear case in point
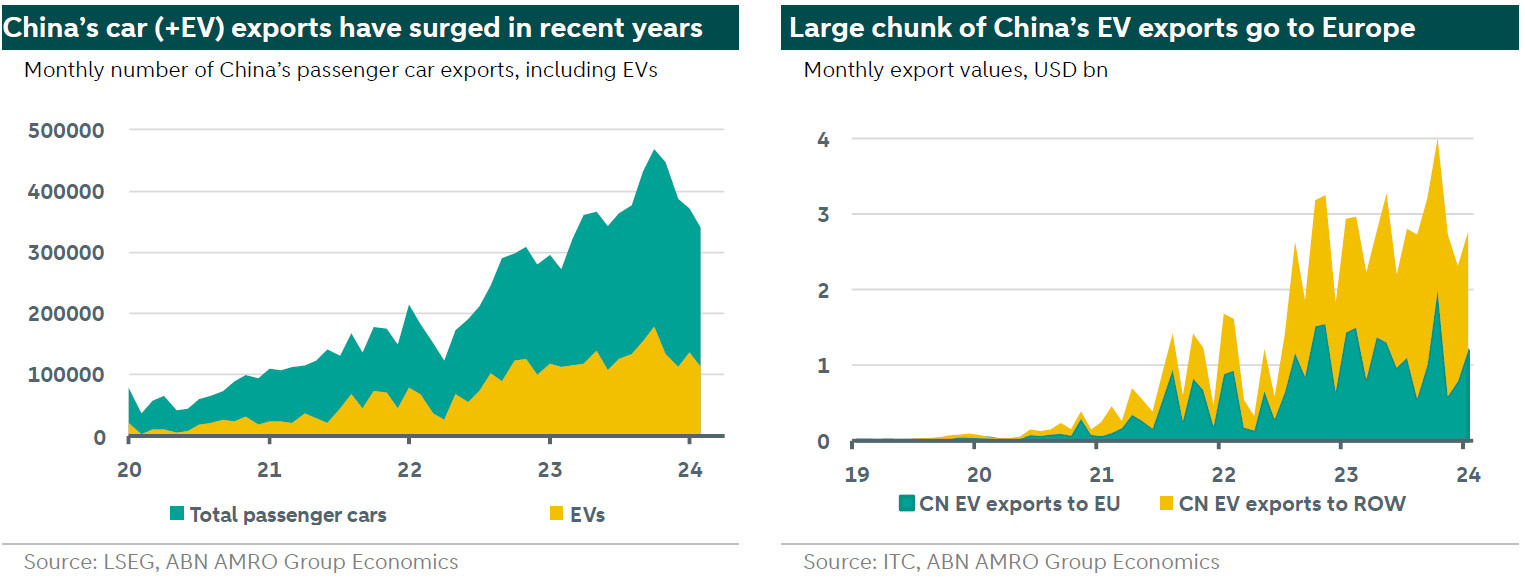
Probably the most striking example in these revolving trade spats are electric vehicles (EVs), also see the earlier coverage in our Annual Outlook 2024 and our China special). Last year, China rapidly emerged as the world’s largest exporter of passenger cars, overtaking Japan. Traditional (internal combustion engine) car exports from China are typically destined for Russia, Mexico and other emerging markets, but the bulk of the EV exports go to Europe. The share of China-made EVs (Chinese brands and foreign brands produced in China) in annual EU sales has risen from 10% in 2020 to around 20% in 2023, and could increase to 25% this year – with the share of Chinese brands rapidly increasing. (1)
Western authorities are not standing pat to what they perceive to be unfair Chinese trading practices. Following up on an investigation into China’s EV industry launched in September 2023, the European Commission recently it found sufficient evidence that EVs imported from China were subject to all kinds of subsidies. The Commission is expected to propose a 25% import tariff (up from the standard 10% currently) by July 2024, with final import duties implemented by November this year. The US has also announced its own investigation into China’s EV sector, citing national security arguments, although US EV imports from China are relatively small compared to the EU.
Balanced approach in protecting industries expected; risks stem from broader tariffs
Additional import tariffs would reduce to a certain extent the deflationary impact stemming from the current global excess supply (dominated by China), although this effect would be small if tariffs would be applied to only one or a few sectors. On another note, tariffs may be not as effective as policy makers hope for, as they typically lead to circumvention. For instance, the 2018 China tariffs imposed by the US led to trade diversion through countries like Vietnam or Mexico. Strikingly in this respect: several Chinese car makers are in talks with certain national governments (e.g. Hungary, Italy) to expand car production facilities in those EU counties. Our base case assumes policy makers to keep choosing a balanced approach while protecting their emerging tech industries, also taking into account the risk of China stepping up retaliation and the fact that China may well be needed in the global energy transition over the longer term. However, there are risks (to inflation and growth) stemming from an intensification of tariff wars, for instance under a potential second Trump-administration – given that the US presidential candidate has threatened with installing a broad universal 10% import tariff and high China-specific tariffs should he return to the White House (see our earlier analysis here).
(1) Financial Times, Chinese-made EVs set to take 25% of European market this year, 27 March 2024.

