SustainaWeekly - More solar power generation in more prosperous municipalities

Solar panel capacity of homes and companies in the Netherlands surged last year. Even though the affordability of solar panels has improved, it is still a substantial investment for many households. In this week’s SustainaWeekly we first explore the relationship between the financial prosperity of municipalities and solar power production in those municipalities. In a separate note, we focus on the updated Green Bond Framework of the Dutch State and how the expenditures have been mapped against the EU Taxonomy. In our final note, we look at the outcomes of an ECB survey of euro area firms on how they look at physical and transition risks, their climate investment behaviour and financing sources and potential impediments to these.
Economist: In 2022, solar panel capacity of homes and companies in the Netherlands increased by an average of about 47%, but the share of renewable energy in total final energy consumption is still relatively low. Typically, the wealthier municipalities generate in most cases more solar power then less prosperous municipalities. Even though the affordability of solar panels has improved, it is still a substantial investment for many households.
Strategist: The Green Bond Framework of the Dutch State has been updated and the expenditures are fully mapped against the EU Taxonomy. Moody’s assessed the new framework as very good in a Second Party Opinion. The expenditures under the Delta fund programme now fully adhere to the EU Taxonomy. There are sufficient eligible expenditures available for the allocation of the proceeds to this issuance and taps in the coming years.
Policy & Regulation: The ECB recently published the results of a pilot round of the Survey on the Access to Finance of Enterprises. The results indicate that 60% of firms attach more importance to transition risks than to physical risks. Only 24% of firms intend to invest in the next five years to reduce their climate footprint. Firms indicate that subsided loans tend to be the preferred option to finance the green transition.
ESG in figures: In a regular section of our weekly, we present a chart book on some of the key indicators for ESG financing and the energy transition.
More solar power generation in more prosperous municipalities
In 2022, solar panel capacity of homes and companies in the Netherlands increased by an average of about 47%, but the share of renewable energy in total final energy consumption is still relatively low
Although the dispersion is wide, a positive correlation can be seen between the financial prosperity of municipalities and solar power production
Typically, the wealthier municipalities generate in most cases more solar power from their solar installations then less prosperous municipalities
When solar panels first hit the market, investment in them was largely limited to homeowners with above-average incomes. This has since changed. Over time financial accessibility - for middle and lower income groups - has become much better. Falling prices of solar installations, incentives and subsidies from the government and also better financing options are partly the reason for better financial accessibility. But the real snowball effect of the past two years was mainly caused by the sharp increase in the cost of living for many households, especially due to higher energy costs. It has led to a very sharp increase in installed solar installations and power in the Netherlands. In this, it is still mainly the richer municipalities that are in the lead. In this analysis, we further explore the trends in solar installations and how their distribution is to municipalities within the Netherlands, with a focus on the financial wealth of these municipalities.
Energy mix Netherlands still fossil rich
The difference between the level of total energy consumption in 1990 and in 2022 is relatively small. Compared to 1990, total energy consumption decreased by only 5%. It is only in the last 12 years that some more significant differences can be observed. For instance, since 2010 - the absolute peak in energy consumption after 1990 - total energy consumption has decreased by 22%. And in 2022, total energy consumption fell by 10% year-on-year, which, however, was mainly caused by a shock (due to the war in Ukraine and the energy crisis that followed later). In the overall energy mix, fossil fuels still have a large share, but the amounts consumed have decreased over the years. At first glance, the chart on the left below suggests that there is very little variation in fossil fuel consumption in amounts of PJ over the years in the underlying energy carriers. But appearances can be deceptive. For coal products and natural gas, consumption in 2022 compared to 1990 is 27% and 25% lower, respectively. In the case of petroleum products consumption, however, the quantities of PJ remained almost the same between 1990 and 2022. The share of petroleum in total energy consumption is also almost identical in 1990 and in 2022. However, the share of natural gas in total energy consumption has decreased from 46% in 1990 to 36% in 2022.
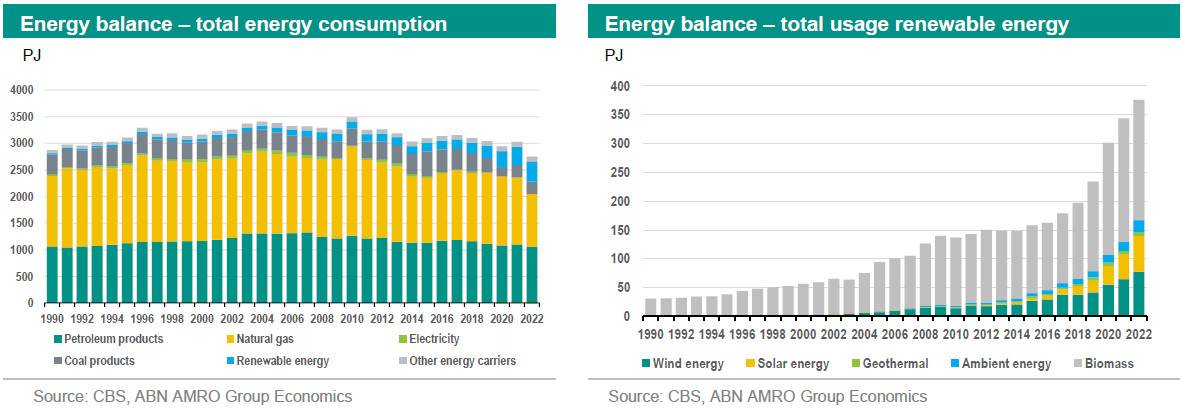
The chart on the left above shows that the share of renewable energy in total final energy consumption is still relatively low. In 2022, this share is 14%. The deployment of renewable energy has increased by as much as 1,106% between 1990 and 2022, an average growth rate of 8% per year. This is a positive trend and it is important to at least maintain this pace. The bottom line is that renewable energy capacity needs more exponential growth in the coming years to make the energy mix more sustainable and meet the EU commitment to generate at least 27% of total energy consumption from renewable energy by 2030. The above figure on the right shows the trend in renewable energy and its sources separately. It shows that the share of solar power is still low compared to the other sources. However, the rate of growth of solar power has been many times stronger than that of other renewable energy sources. This is clearly shown in the left-hand figure below. Actually, the growth of almost all renewable energy sources since 2010 has been impressive, but that of solar power can be called exceptional. Growth has particularly accelerated in the last five years.
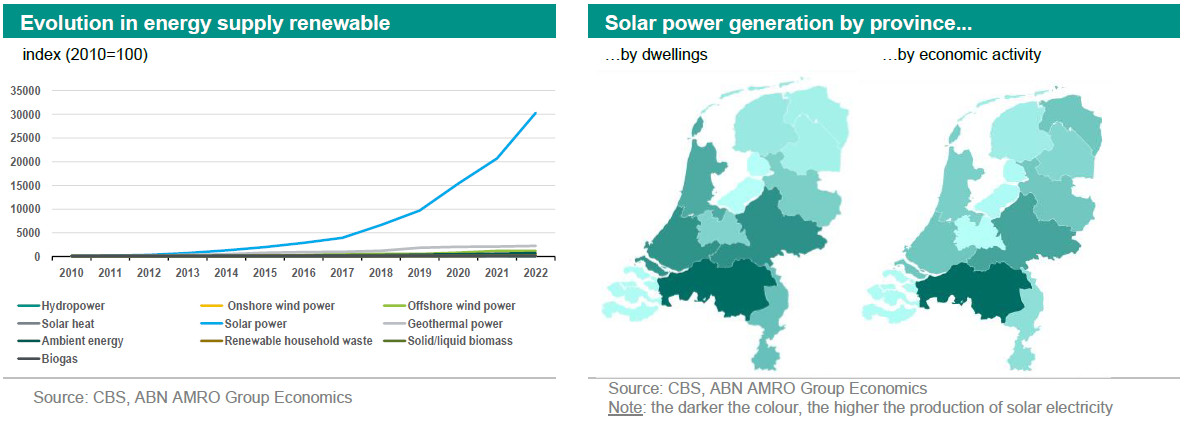
Over the past five years, solar electricity supply has increased by 356%, followed by ambient energy (heat extracted with a heat pump), which saw 125% growth over five years and wind energy (+121% over the same period). In solar electricity production, the province of North Brabant is the absolute solar king. This applies to production by both homes and companies. In 2022, the capacity of solar panels of homes and companies in the Netherlands increased by an average of about 47%. The provinces of Utrecht, South Holland and Zeeland saw the largest increase in residential solar power production. For companies, these were the provinces of Gelderland, Drenthe and Overijssel.
The sun no longer comes up for nothing
Of the 17 billion kWh of solar power in 2022, 59% is generated by companies. The remaining share (41%) comes from homes. For homes, the year-on-year growth in solar power generation was a fraction higher than the growth of solar power in companies (49% versus 45%). Obviously, when more solar panels are installed, solar power production increases correspondingly. This is also evident from the distribution of number of solar installations per dwelling and solar power per dwelling in the various municipalities (see chart on the left below). With a higher than average number of solar installations per dwelling and solar power per dwelling, the distribution increases more.
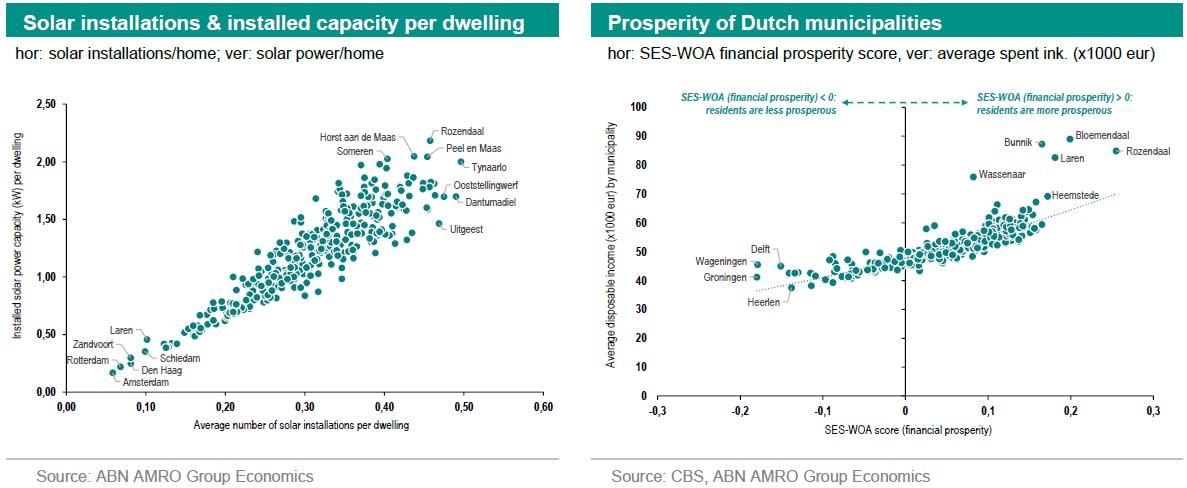
It goes without saying that a higher average disposable income results in higher financial prosperity. This financial prosperity varies across municipalities and is expressed by the CSB as a score. The indicator refers to both disposable income and household wealth. In general, if financial prosperity is relatively low, it is often a barrier for households to invest in renewable energy generation. Households in municipalities with higher average disposable income and assets (such as Rozendaal, Bloemendaal, Laren) are often able to make this kind of investment. Following this, it is interesting to see whether it is indeed true that households in municipalities with a higher share of high household incomes tend to invest more in solar power generation than households with a low score in terms of financial wealth (such as Groningen, Heerlen, Wageningen).
There are different housing types, such as mid-terrace houses, corner houses, detached houses and flats. These homes all have different levels of electricity consumption. A mid-terrace house or a flat, for example, usually needs less electricity and energy than a corner or detached house. This is because an intermediate house or flat is often more compactly built than a corner or detached house. The left figure below shows - despite the fact that the variation is large in the data - that the higher the proportion of detached houses and corner houses in a municipality, the higher the average electricity deliveries1) to these houses are. For example, the municipalities of Rozendaal and Blaricum have a relatively high proportion of detached houses and corner houses, and electricity deliveries in kWh are also relatively high in these places. But this need not always be the case. For the Frisian municipality of Dantumadiel has the largest share of detached houses and corner houses in the Netherlands, while the average electricity deliveries here are again relatively low. And finally, Amsterdam has the least number of detached houses and corner houses in the Netherlands, while the average electricity deliveries are the lowest in the whole of the Netherlands.
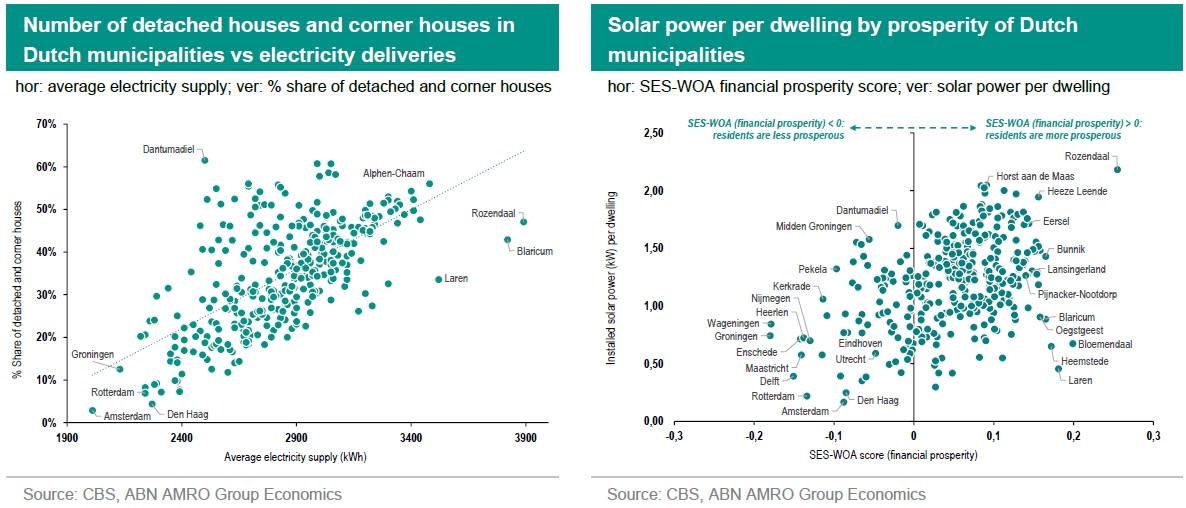
There is a correlation between the financial prosperity of municipalities and the production of solar power. Typically, it is the wealthier municipalities that can generate a significant amount of solar power from their solar installations. This is partly because financial accessibility is much better for higher-income households than lower-income households. However, the spread is wide in the distribution of generated solar power by financial prosperity. For instance, some less wealthy villages and/or towns (such as Dantumadiel, Central-Groningen) already have a considerable number of roofs equipped with solar panels, and some wealthy villages and/or towns lag considerably behind (such as Laren) poorer villages and/or towns in harnessing solar energy potential. The data also shows that larger cities in the Netherlands (such as Amsterdam, Rotterdam and The Hague) have low solar panel density compared to smaller towns and villages. In larger cities, it is often much more difficult to create space for solar panels, than in outlying areas with typically more space and opportunities. All-in-all, financial considerations will remain an important factor for many households in whether or not to invest in solar panels in the future. Even though the affordability of solar panels has improved, it is still a substantial investment for many households. That is why financial incentives from the government are so important going forward to keep that investment within reach for both middle and lower income groups and to keep the pace in adding renewable energy to the grid.
1) This is the gross electricity supply, i.e. without the netting of any feed-in to the electricity connection by generation from (mainly) solar panels.