CO2 price is set for upward trend again to meet climate goals

The EU ETS system is the largest of its kind globally and remains the European Commission's (EC) main tool to make companies in sectors more sustainable. In the Netherlands, around 350 companies are compulsorily covered by EU ETS and collectively they account for 44% of total greenhouse gas emissions.
Economic activity and energy prices have a large impact on the CO2 price trend and keeps the volatility in the CO2 price high
The number of free emission allowances for EU ETS companies will decrease in the coming years and will be history from 2034, while the number of allowances will generally continue to decrease
These powerful forces mean that CO2 price still be set for upward trend over medium term
Due to the tightening in EU-ETS, the role of auctioning allowances and trading them in the financial markets will become more important
Under the EU Emissions Trading Scheme (EU ETS), Europe's largest emitters of greenhouse gases in energy supply and industrial sectors must pay for every tonne of CO2 they emit. It is the world's largest carbon market with a traded value of about EUR 751 billion in 2023. It is a key policy tool of the European Commission (EC) to drive the carbonisation of companies and help the EU to meet its emission reduction objectives. In this analysis, we take a closer look at the EU ETS and the volatility of the CO2 price. Furthermore, we show the trend in greenhouse gas emissions in Europe and the Netherlands from the major emitters covered by the EU ETS regime and how the CO2 price has played a role in reducing these emissions.
Volatility in European greenhouse gas emissions
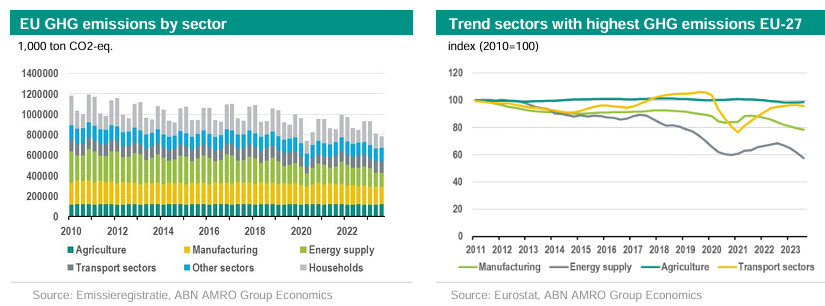
Within EU ETS, greenhouse gas emission allowances are traded. It allows the EU to reduce greenhouse gas emissions in an effort to meet climate targets towards 2030 and 2050. Thus, the EU annually limits the number of available free allowances. This puts upward pressure on the auction price for an emission allowance, also known as the CO2 price or the European Union Allowance (EUA) price. As a result, it makes investing in sustainability more attractive for companies and reduces greenhouse gas emissions. In Europe, there is a clear downward trend in greenhouse gas emissions. In the first three quarters of 2023, greenhouse gas emissions are 21% lower than in the same period in 2010. Compared to last year, GHG emissions in EU-27 was 7.1% lower, which was also due to slower economic activity in sectors.
In the agriculture and transport sectors, GHG emissions have decreased only slightly over the past 13 years - by 1% and 4% respectively – while in energy supply and industry, GHG emissions have fallen by 44% and 22% respectively. These sectors have been under the EU ETS regime since the launch of the system. It shows that the EU ETS is helping the EC to meet its climate targets. Outside the EU, China, California and the UK also have a functioning carbon markets. However, the differences between these trading systems are large. In the near future, the EC is going to encourage countries outside the EU to also set up an emissions trading system. To this end, the EC plans to set up a task force that can deploy staff to set up an ETS system in countries outside the EU.

Since its introduction in 2005, the EU ETS has been revised three times: in 2008, 2013 and 2021. Most of these revisions were aimed at making the system more restrictive and effective. The underlying goal of EU ETS is for companies in the covered sectors to reduce their emissions by 62% by 2030 compared to 2005 levels. Before 2022, this was 43%. The number of allowances within EU ETS is thus decreasing faster and all other things equal puts upward pressure on the CO2 price. However, such tightening of the EU ETS also increases concerns about carbon leakage. A higher CO2 price increases the costs for EU manufacturers and therefore they lose competitiveness against non-EU manufacturers (who mostly do not have a price on emissions). In theory, it is then possible that EU manufacturers are more likely to decide to move their production facilities to regions outside the EU ETS. In this case, the carbon emissions that first took place in Europe moves (or leaks) to regions outside Europe, and there is a good chance that the amount of GHG emissions will not change on balance. In addition, carbon leakage increases the likelihood of job losses in Europe. To address the problem of carbon leakage and create a level playing field for EU producers, the Carbon Border Adjustment Mechanism (CBAM) is being phased in. Currently, CBAM is still in the three-year transition phase (from 1 January 2023) with a reporting requirement for importers. From 1 January 2026, importers must actually start buying CBAM certificates, the price of which is linked to the CO2 price. For more insight in EU-ETS, see here.
Greenhouse gas emissions and EU ETS in the Netherlands
According to the Netherlands Emissions Authority (NEA), the EU ETS is the largest of its kind globally. In total, about 10,000 European companies are covered by the system. Collectively, they are responsible for about 45% of EU greenhouse gas emissions. In the Netherlands, about 350 companies are compulsorily covered by the EU ETS.

These companies account for 44% of the total emissions in the Netherlands and are mainly active in energy supply (such as electricity and heat production), energy-intensive industrial sectors (such as chemicals, oil refining, food production and metals) and intra-EU commercial aviation. From 2025 and 2027, the EU ETS 2 will be phased in. This is a new separate cap-and-trade system covering emissions from road transport, the built environment and industrial sectors not covered by the EU ETS. More on the EU ETS 2 system can be found here.
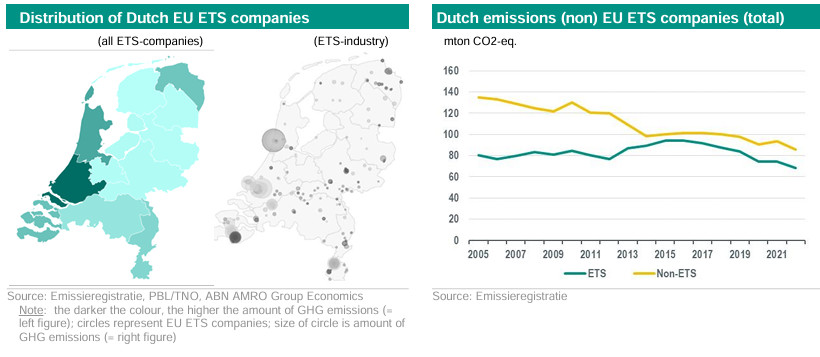
The majority of Dutch EU ETS companies (56%) are from industry (mainly chemical, oil and base metal industries), followed by companies active in energy supply (43%). These companies operate all over the Netherlands, but the concentration is mainly on the west coast of the Netherlands and in North Brabant, Limburg and Groningen.
At the start of EU ETS, 63% of Dutch GHG emissions were not covered by the EU ETS. Since 2005, non-ETS GHG emissions have been steadily decreasing. This is not only because more and more companies have started to become more sustainable, but also because more companies and installations were added to the EU ETS between 2005 and 2022. It is partly for this reason that between 2005 and 2012, GHG emissions from EU ETS operators remained stable and then increased until 2015. After 2015, GHG emissions have been on an a decreasing trend.
Trend in CO2-price
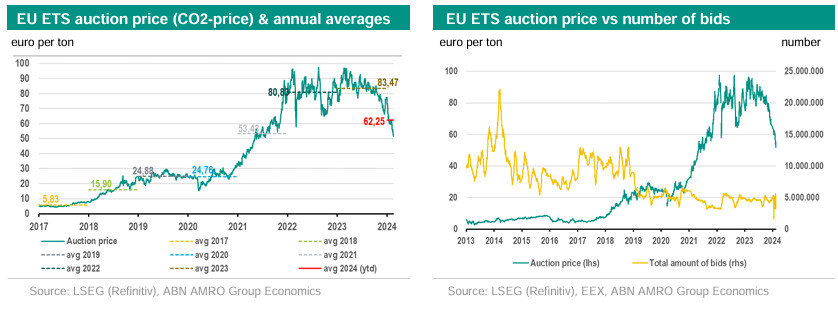
In the period 2005-2007, emission allowances were so abundantly distributed, which kept the CO2 price extremely low. From 2008 to 2012, more and more companies and installations were added to EU ETS. Moreover, nitrogen emissions also became part of the EU ETS. The CO2 price started to move higher during this period.

From 2012 to 2017, the CO2 price remained relatively low, hovering annually around the long-term average of at EUR 8 per tonne. There was a surplus of allowances during this period, mainly due to a number of years with moderate economic activity. Because allowances can be stored, this also had an effect in the years following weaker economic periods. The EU ETS system faced criticism that such a low price over an extended period would not motivate companies enough to reduce greenhouse gases. Total bids have been structurally lower since 2021 compared to the 2013-2020 period. Here, the relatively high CO2 price after 2021 for the emission allowances, some reforms in the EU-ETS-system which affected total supply of allowances and the impact of sustainability initiatives among companies has affected the number of bids. And despite the rapid fall in the price since the beginning of this year, the number of bids for emission allowances in the EU remains relatively low for now, even reaching a record low in over 10 years on 24 January this year.
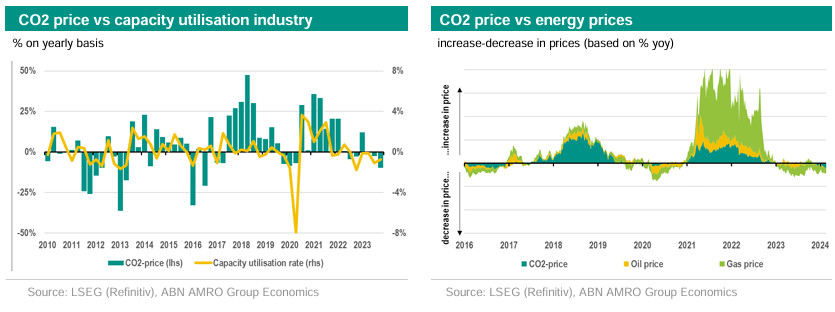
Several studies show that economic activity and energy prices (such as oil and natural gas) can significantly influence demand for allowances and the CO2 price (see both figures below). A relatively weak economy results in a lower carbon price because business activity is at a lower level. For example, if an economy is in recession, the capacity utilisation rate in industry decreases, which means that fewer allowances are needed and the number of EU ETS bids decreases.
Energy prices also affect the CO2 price. Higher oil and gas prices reduce the demand for oil and energy. This reduces greenhouse gas emissions, which reduces the number of emission allowances needed. This causes the CO2 price to fall. But it is not only demand from industry that affects the total number of bids for allowances in the EU ETS system. Less demand for energy - from businesses and households, for example - will also reduce the demand for new allowances from energy supply companies. For example, savings in gas consumption or higher average temperatures have the effect of lowering the demand for gas and thus requiring fewer allowances. However, the effect of higher or lower energy prices never affects the CO2 price one-to-one. This is because in addition to economic activity and energy prices, other factors - such as the introduction of breakthrough emission reduction technologies and the front loading of allowances - can also influence the CO2 price.

In the coming years, the EU ETS system and the level of the carbon price will remain a powerful tool for the EC to further stimulate sustainability amongst EU ETS companies. The number of free allowances will gradually decrease and become a thing of the past from 2034, in parallel with the gradual introduction of CBAM. At the same time, the number of available allowances will also be further reduced by accelerating the reduction of the cap on the one hand, and by withdrawing some allowances from the market on the other. With such adjustments in EU ETS, the role of auctions of allowances and their trading in the financial market will become more important. With that, the price dip since the start of this year is only a temporary phenomenon and it will start to increase again with the adjustments in the number of allowances in the coming years. See also our views on CO2 price here. However, due to the large number of CO2 price-influencing factors, volatility in CO2 price will remain high.
