Battery electric the best option for road mobility based on life cycle emissions
In road mobility there are several ways to decarbonize. The options are battery-electric, fuel-cell electric with hydrogen and an engine burning a fuel. Every option has its life cycle emissions.
The total life-cycle emissions of vehicles include vehicle production, battery, fuel cell or fuel production, maintenance, use and end of life, where electricity mix and the fuel used have important impacts on the total emissions.
For most forms of road transport battery electric vehicles charged on renewable electricity have the lowest life-cycle emissions, while vehicles with internal combustion engines burning fossil fuel or a mix of fossil fuels and biofuels have the highest total emissions
In some cases internal combustion engines burning synthetic fuels could approach the low life-cycle emissions of battery electric vehicles
Introduction
In the road mobility sector there are several ways to decarbonize. The options are battery-electric, fuel-cell electric with hydrogen and an engine burning a fuel. Every option has its life cycle emissions. In this report we focus on the life-cycle emissions of the different options. We start with the life-cycle emissions of the battery in an electric vehicle. Then we continue with the life-cycle emissions of a fuel cell used in mobility and the associated emissions of the different fuels. Then we go a step further where we compare the life-cycle emissions of the different vehicles, before setting out some conclusions.
Metrics used in this report
In road mobility there are several metrics that can be used: vehicle kilometres, passenger kilometres and tonne-kilometres. Vehicle kilometres (vkm) are the stock of vehicles in use multiplied by the average distance travelled. The passenger kilometres (pkm) equals the vehicle kilometres multiplied by the occupancy rate of a vehicle. Tonne-kilometre (tkm) is a unit of measure for freight transport which represents the transport of one tonne of goods by certain transport mode over a distance of one kilometre. In the US, for instance, this number is higher because the trucks are larger than in Europe.
Kilowatt-hour (kWh) is a unit of energy and is used when referencing electric car battery capacity and the amount of energy put into the battery from the charger. One kilowatt is equal to 1,000 watts. The average energy consumption is 0.2 kWh per kilometre depending on the car, driving style and when it is driven. For example if you driver faster than 100km per hour, the battery of the car discharges at a quicker rate and lasts shorter. Another example is that colder weather results in a lower driving range.
The life cycle assessment (LCA) is in kilograms CO2eq per kWh. CO2eq is a metric measure used to compare the emissions from various greenhouse gases on the basis of their global-warming potential (GWP), by converting amounts of other gases to the equivalent amount of carbon dioxide with the same global warming potential. Global Warming Potential is a term used to describe the relative potency, molecule for molecule, of a greenhouse gas, taking account of how long it remains active in the atmosphere.
Life cycle assessment of batteries in electric vehicles
In this section we only focus on the life-cycle emissions of the different battery chemistries found in electric vehicles. We have also added the emissions of the solid state battery as it is a major emerging technology likely to be launched in the coming years. Car manufacturers are working hard to overcome the challenges of this chemistry to introduce it in vehicles within 5 years.
The life cycle assessment (LCA) of EV batteries includes emissions from mining, processing, active material production, battery manufacturing, and recycling. The active materials in a battery are the chemically active materials of the two electrodes of a cell and the electrolyte between them.
Below there is an overview of the LCA of the different battery chemistries. Not only the chemistry is important but also where the batteries are produced. For example batteries produced in Europe have the lowest life cycle emissions. This is because the energy used to produce batteries tends to come more from renewable sources in Europe than for example in China.
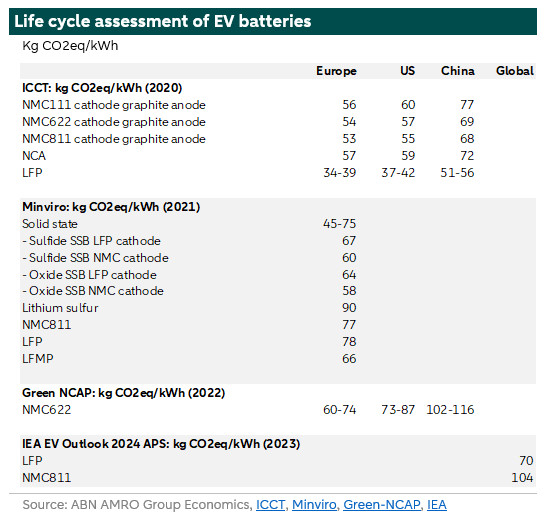
The table uses a lot of abbreviations. We explain the major ones. NCA stands for LithiumNickel (x) Cobalt (y) Aluminium (z) Oxide. Xyz indicates the shares of each component. Together they are 100% (or 1). NMC means LithiumNickel(x) Manganese (y) Cobalt (z) O2 where x+y+z=1. So NMC622 means LithiumNickel (0.6) Manganese (0.2) and Cobalt (0.2) Oxide. NMC111 means LithiumNickel (0.333) Manganese (0.333) and Cobalt (0.333) Oxide. NMC batteries, especially 622 and 811, are widely used in electric vehicles because these batteries have high energy density. These batteries are relatively expensive and there is a wish to minimize the content of cobalt (because of mining conditions). Therefore, there is a trend for using more LFP batteries which have lower energy density, but have more cycles and are cheaper. LFP stands for Lithium Iron Phosphate (LIFEPO4). A lithium manganese iron phosphate (LMFP) battery is a lithium-iron phosphate battery (LFP) that includes manganese as a cathode component.
The emerging batteries in the table are solid state battery and lithium sulfur. Solid state technology is a battery that uses a solid electrolyte compared to liquid electrolyte in lithium-ion batteries. Liquid electrolyte can be dangerous and unstable accidentally short-circuiting or overcharging. A solid electrolyte prevents such event from happening. Another advantage is that solid state batteries have higher energy density from 400 Wh/kg potentially to up to 2,600 Wh/kg. This is substantially higher than current lithium-ion batteries with an energy density of 240-350 Wh/kg. Finally, they envision to have more cycles compared to lithium-ion batteries. This emerging technology has also some disadvantages. For a start, solid state batteries have high internal resistance at solid electrodes and electrolyte interfaces, which slows down the fast charging and discharging process. Moreover, the costs are still high as it is an emerging technology. Mass production seems difficult as there is scarcity of a reliable candidate for a solid electrolyte. Finally, during charges and discharges root-like build-up (dendrite) form on lithium metal in the anodes. Dendrite build-up reduces the amount of solid electrolyte capacity and thus the stored charge.
The table above shows that producing batteries in Europe have the lowest LCA. Moreover, LFP batteries have lover LCA according to three of the studies used compared to other chemistries. The emerging battery chemistry solid state have life-cycle emissions somewhat close to the NMC chemistry.
The question is what is the share of the life cycle emissions of the battery compared to the overall life cycle emissions of electric vehicles. The LCA of the battery in electric vehicle is around 25% of the total LCA of an electric vehicle. Vehicle manufacturing excluding battery manufacturing is around 50%, maintenance and emissions for producing green electricity the rest (. These shares are for vehicles that use green electricity. The shares differ when the current grid is taken into account. Then the share of emissions of the battery production on the total decrease as there are more emissions for the electricity used. We will discuss the total life cycle emissions for cars more extensively later in this report.
Life-cycle emissions of fuel cells
A fuel cell uses the chemical energy of hydrogen or other fuels to cleanly and efficiently produce electricity. If hydrogen is the fuel, the only products are electricity, water, and heat. Fuel cells work like batteries, but they do not run down or need recharging. They produce electricity and heat as long as fuel is supplied. There are different forms of fuel cells but not every form is suitable to be placed in a vehicle. The fuel cell that is mostly used is the Polymer Electrolyte Membrane (PEM) fuel cell also called a proton exchange membrane fuel cell. They use solid polymer as an electrolyte and porous carbon electrodes containing platinum or platinum alloy catalyst. They need only hydrogen, oxygen from the air and water to operate. They are typically fuelled with pure hydrogen supplied at storage tanks or reformers. PEMs operate at relatively low temperatures, 80 degrees Celsius. Low-temperature operation allows them to start quickly (less warm-up time) and results in less wear on system components.
The carbon footprint of a PEM fuel cell is estimated to be 1160 kg CO2 for a 48kWe (kilowatt-electricity) stack . Platinum is responsible for 63.5% of this because of the platinum mining/extraction. Generators’ power is rated in kilowatts (kW), which is a measure of 1,000 watts. There are two types of kW. First mechanical kW or kWm and second the electrical kW or kWe. The kWm is the mechanical power driving the generator. The electrical kWe is the actual useful power available to the end user and takes into account power losses due to the efficiency of the generator as well as fan power needs . In subsequent sections we show the total life cycle emissions for fuel cell vehicles.
Life cycle assessment of different fuels
So far, we have focused on the life-cycle emissions of batteries, fuel cells and now our focus shifts to the LCA of the fuels that can be used in mobility (with or without engine modification).
Replacing fossil fuels by fuels that emit less or no emissions is a complicated endeavour. For a start there are many different types of more sustainable fuels. Each of these fuels has its own characteristics and therefore different fuels would be suitable for different applications. Different fuels have different energy density levels, which can be measured in terms of equivalent energy released through combustion. To replace fossil fuels by more sustainable equivalents, changes need to be made to for example engines or the infrastructure and storage. The supply, production and price of more sustainable fuels are less favourable compared to their current fossil equivalents and this will take time to change. The production of synthetic fuels needs large amounts of green electricity and feedstock and there is often competition for these sources. In some cases the technology is not commercially available yet. So production needs to increase and prices need to come down. These fuels are also called synthetic fuels . Synthetic fuels are liquid fuels that have the same properties as fossil fuels but are produced artificially. Synthetic fuels can be blended with fossil fuels or replace the fossil fuel in internal combustion engines. These synthetic fuels are used for different purposes and different sectors. There are three types of synthetic fuels and the way they are produced makes them distinctive.
Biomass-to-liquid/gas produces biofuels (any fuel that is derived from biomass) such as renewable diesel/hydrotreated vegetable oil (HVO) and Sustainable Aviation Fuel (SAF)
Power-to-liquid/gas produces e-fuels (electro fuels) such as e-methane, e-kerosine, e-methanol and hydrogen
FT fuels in the table below are fuels produced via the Fischer-Tropsch process. The Fischer-Tropsch process is a catalytic chemical reaction in which carbon monoxide (CO) and hydrogen (H2) in the syngas are converted into hydrocarbons of various molecular weights. FAME and HVO are also mentioned in this table. FAME is bio-diesel. Bio-diesel is a renewable fuel that can be manufactured from vegetable oils, animal fats or recycled cooking grease for use in diesel vehicles. Hydrogenated Vegetable Oil (HVO) is made from a variety of vegetable oils and fats containing triglycerides and fatty acids. HVO is renewable diesel. Renewable diesel is a fuel made from fats and oils and is processed to be chemically the same as petroleum diesel. The production process is different than that of biodiesel but it is coming from similar feedstock.
The red line in the table shows which fuels burnt internal combustion engine cars could compete with battery electric vehicle. The fuels on the left of the red line could compete in terms of life-cycle emissions, the fuels on the red have higher life-cycle emissions. See more on this below.
The table below shows the LCAs of conventional fuels and synthetic fuels.
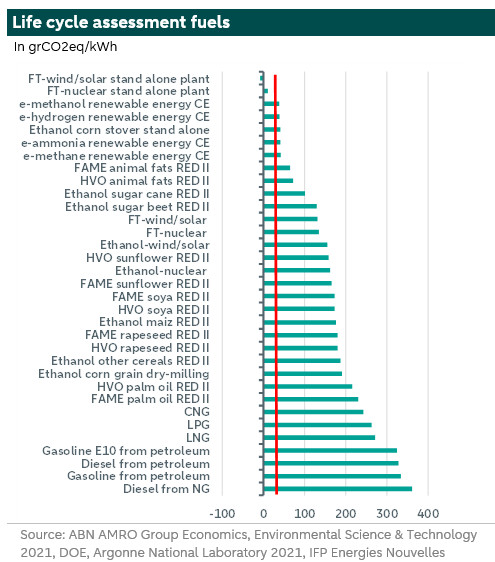
The main question is what is the cleanest fuel according to the data in the table above. FT fuels made using renewable electricity from stand-alone plants have the lowest life cycle emissions compared to the same fuels produced in integrated plants. This is followed by FAME and HVO made from animal fats under the EU Renewable Energy Directive II (RED-II). The fuels with the highest carbon footprint are the fossil fuels, but FAME and HVO produced from palm oil also have relatively high life cycle emissions.
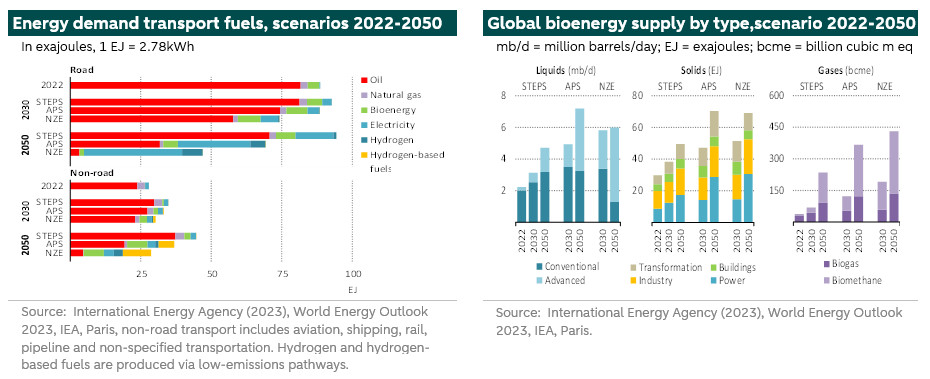
Another important question is whether the supply of these fuels will be sufficient to replace fossil fuels. The graph below on the left shows the energy demand in transport fuels in the different IEA transition scenarios. The different scenarios are STEPS, APS and NZE. STEPS is the Stated Policies Scenario, APS is the Announced Pledges Scenario and NZE is the Net Zero Emissions by 2050 Scenario. According to the IEA, demand for fossil fuels for road and non-road mobility will remain substantial in all scenarios up to 2030. This is because of the limited production of bioenergy. Bioenergy production has a small share compared to the share of fossil fuels (oil and natural gas). Indeed, the share in global production of bioenergy by 2030 is around 15% in the STEPS scenario and 28% in the NZE scenario.
LCA of technologies of road mobility
Above we focused on the life cycle emissions of batteries used in electric vehicles, of fuel cells and of the different fuels used in mobility. In this section we show the results of the life cycle emissions of the different vehicles in road transport. These emissions are from cradle to grave including vehicle production, battery or fuel cell production, maintenance, use and end of life. Electricity mix and the fuel used have important impacts on the total emissions.
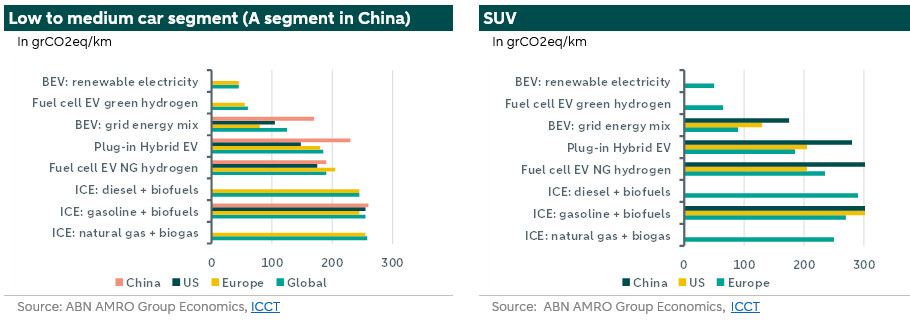
In the low to medium car segment and for SUVs, vehicles with internal combustion engines (ICEV) have the largest life cycle emissions even if the fossil fuel is mixed with biofuels. For these vehicles, the largest emissions are during vehicle operation use. Battery Electric Vehicles (BEV) have the lowest life cycle emissions if renewable electricity is used followed by a fuel cell vehicle fuelled by green hydrogen.
The advantage for battery electric vehicles diminishes if we take the current electricity mix which is only partly renewable (however it will become more renewable over time).
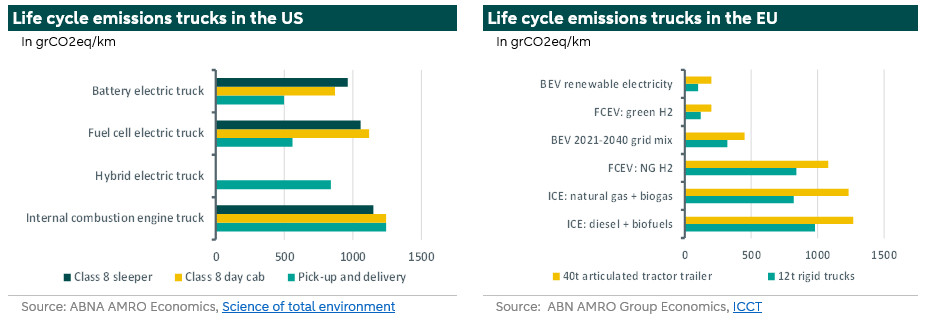
For trucks, the results are the similar. Battery electric trucks have the lowest life cycle emissions especially if they are charged with renewable energy. In the US there are several types of trucks but we mentioned below Class 6, Class 8 day cab and Class 8 sleeper trucks. A Class 6 truck is a medium-duty commercial truck with a gross vehicle weight rating (GVWR) between 19,501 and 26,000 pounds (9-12 tonnes). A Class 8 truck has a GVWR higher than 33,000 pounds (15 tonnes). In the EU, there are different ways to classify trucks. They can be classified according to their structure, the type of containment of the goods and their weight. In Europe there are N2 trucks, weighing more than 3.5 tonnes, and N3 heavy trucks weighing more than 16 tonnes. Below we mentioned 12 tonne rigid and 40 tonne articulated tractor trailer. In rigid trucks their structure is in one piece, and the driver’s cab is attached to the goods transport trailer, with no possibility of separation. Articulated trucks are divided into two separate parts: the driver’s cab and the trailer where the goods are transported.
In some cases internal combustions engines burning synthetic fuels is also an option. The sum of life-cycle emissions of battery manufacture, the vehicle manufacture and maintenance is higher for electric vehicles than for internal combustion vehicles. If then the fuel is replaced by a synthetic fuel which reduces life cycle emissions by around 90% and all the electricity used in producing the fuel is from renewable sources then this could result in lower life cycle emissions than for battery electric vehicles. We think that the fuels which remain on the left side of the red line in the graph of LCA of fuels could result in lower life cycle emissions than that of battery electric vehicles.
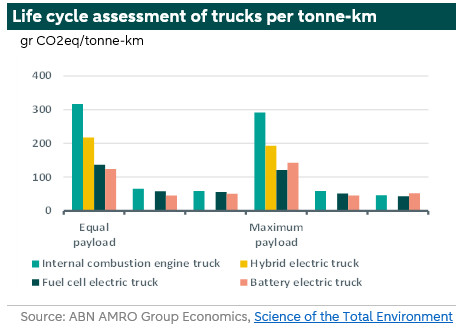
The graphs above are based on grams of emissions during the life-cycle per vehicle kilometre. This does not take into account the payload of the vehicles. For example, in the US, the trucks are larger so the life-cycle emissions per tonne-kilometre are lower than in the EU. The chart below shows the LCA for the US trucks taking into account the payload. According to data of the IEA, the total emissions of trucks per tonne-km for trucks world-wide in 2022 was 59, while for the Netherlands it was almost double of this mainly because of less tonnes per km transported.
Conclusion
In road mobility there are several ways to decarbonize. The options are battery-electric, fuel-cell electric with hydrogen and an engine burning a fuel. Every option has its life-cycle emissions. The total life-cycle emissions of vehicles include vehicle production, battery or fuel cell production, maintenance, use and end of life. Electricity mix and the fuel used have important impacts on the total emissions. For most forms of road transport, battery electric vehicles charged on renewable electricity have the lowest life-cycle emission while vehicles with internal combustion engines burning fossil fuel or a mix of fossil fuels and biofuels have the highest total emissions. However, in some cases internal combustions engines burning synthetic fuels could have life-cycle emissions around that of battery electric vehicles.