SustainaWeekly - What has driven sovereign greeniums lower?


In this week’s SustainaWeekly, we start by investigating the dynamics of sovereign green bonds, focusing on core (Germany) and semi-core (France and Belgium) EU countries. Sovereign greeniums have declined in almost all cases. Our key conclusion is that that liquidity and volatility seem to be explanatory factors for the movement in greeniums of sovereign bonds. We go on to review whether more highly-rated ESG issuers are particularly vulnerable to the higher interest rate and credit spread environment, which has driven the market rate on European high yield debt to 10-year highs. We conclude that solid ESG issuers are not worse off in terms of interest rate coverage (ICR) today nor are they subject to a larger fall in ICR than weaker ESG names.
ESG Bonds
We investigate the dynamics of sovereign green bonds, focusing on core (Germany) and semi-core (France and Belgium) EU countries. Sovereign greeniums have declined in almost all cases. We conclude that the greenium seems to be negatively impacted by higher market volatility and lower liquidity. However, we see some exceptions to this, such as with the German 2025 and the Belgium 2033 green bonds.
Strategist
High yield coupons have reached close to 9%, raising refinancing fears for riskier companies. We investigate whether better-rated ESG high yield names could be more affected by the spectacular rise in financing costs. On the basis of a sample of 54 high yield names, we conclude that solid ESG issuers are not worse off in terms of interest rate coverage (ICR) today nor are they subject to a larger fall in ICR than weaker ESG names.
ESG in figures
In a regular section of our weekly, we present a chart book on some of the key indicators for ESG financing and the energy transition.
Liquidity and volatility as key explanatory factors for the greenium of sovereigns
We investigate the dynamics of sovereign green bonds, focusing on core (Germany) and semi-core (France and Belgium) EU countries
We show that market volatility has driven a “de-coupling” amongst sovereign greeniums, which have decreased in almost all cases
Furthermore, we conclude that the greenium seems to be negatively impacted by higher market volatility and lower liquidity
However, we see some exceptions to this, such as with the German 2025 and the Belgium 2033 green bonds
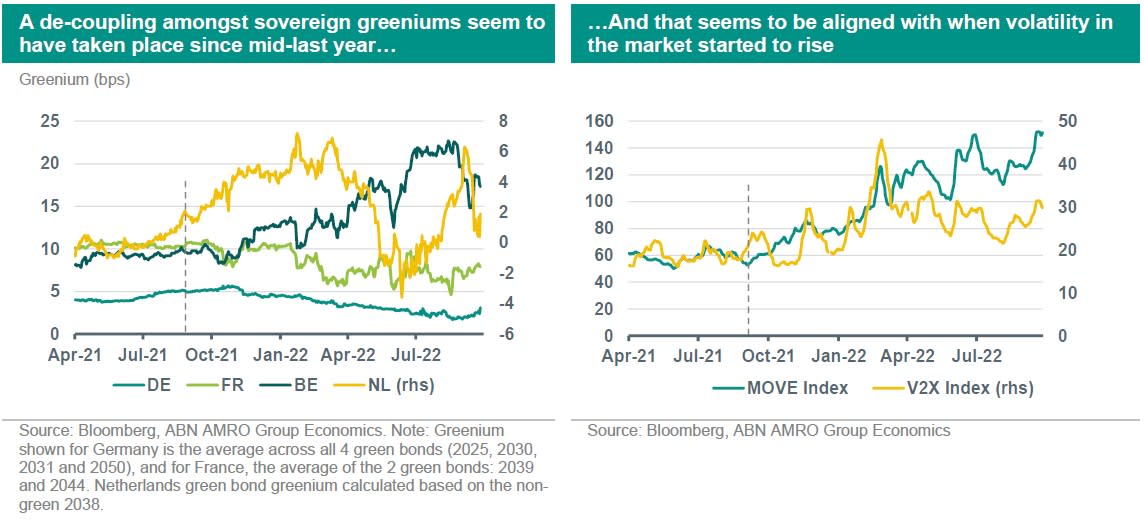
In this piece, we attempt to investigate the drivers of the greeniums for core and semi-core EU sovereigns. By greenium, we mean the yield difference between a non-green bond and a green bond with comparable duration. Hence, the more positive the difference, the higher the greenium. Over the past 1.5 years, we have seen the greenium for sovereigns become (i) more volatile and (ii) more dispersed, as shown in the chart below. While the greenium amongst sovereigns tended to trade relatively aligned between 8-10bps for Belgium and France, between 4 and 5bps for Germany, and only around 1bps for the Netherlands, this changed during the course of 2021 Q3. Interestingly, this seems correlated to a rise in rates volatility (proxied by the MOVE index). Also when looking at the V2X Index, used to gauge market volatility, the decoupling seems to align with the rise in the index.
Bund greenium is shrinking
European sovereign bonds sold off significantly in the past weeks and green bonds were no exception, as shown in the table below. Looking at German bonds, which provide a good proxy for greenium given their “twin bond” approach (see more below), the green bonds slightly underperformed the conventional ones, except for the 3y tenor. This comes a bit as a surprise, given the presumption that green bonds would be less affected by changes in market sentiment. However, the data clearly show that green sovereign bonds have been subject to the same headwinds as the broader market. One explanation for this could relate to the fact that the risk-off mode and the heightened volatility that has dominated the market, have been driving investor demand for safe but also highly-liquid assets. And we will see that German Green bonds tend to be less liquid than their non-green peers.
Germany has adopted a Twin Bond Concept where each green bond matches an existing conventional bond with identical features. This was partly to address liquidity concerns for green bonds, indeed allowing investors to swap green bonds for conventional ones at a low cost for switching. The benefit is that it makes it easy to measure the greenium for German government bonds.
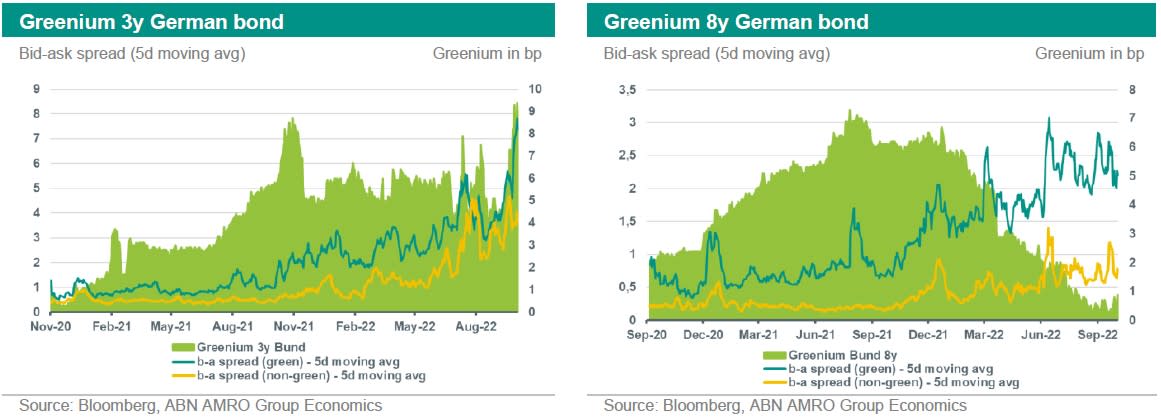
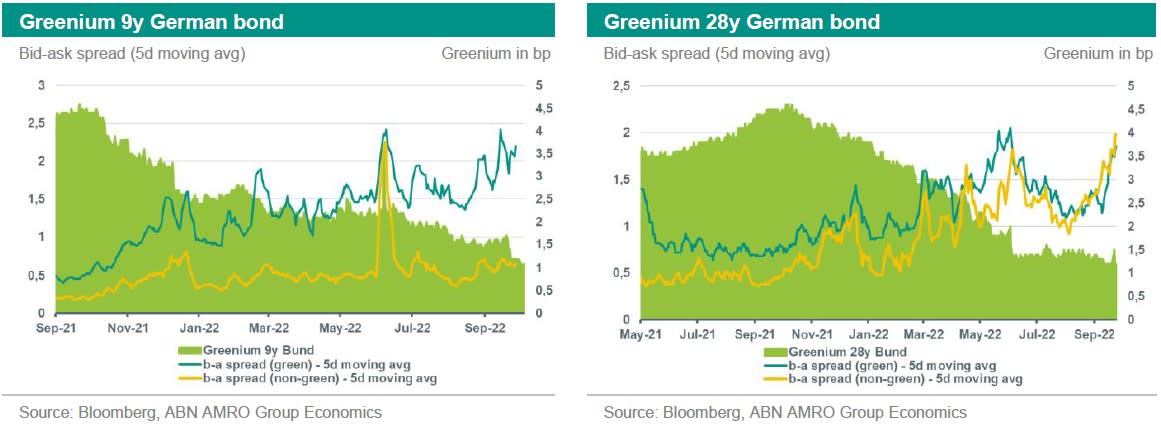
When comparing the liquidity of green to non-green bonds in parallel to the greenium development, two conclusions can be drawn from the graphs below. Firstly, the green German government bonds tend to be less liquid than their non-green peers. Using the bid-ask spread as a proxy for liquidity, and using the 5-day moving average to smooth the series, we see that the bid-ask spread proves to be consistently wider for green bonds. This indicates higher transaction costs and tighter liquidity in the secondary market for green bonds. Secondly, the greenium declines as liquidity worsens in the market (both for the Green and conventional markets, as shown by wider bid-ask spreads). Indeed, the worsening of liquidity conditions and shrinking of sovereign greeniums is more than a mere coincidence. We find bid-ask spreads and volatility (as shown in the chart on the previous page) to be significant variables in explaining the greenium on the German green bond. We see the contribution of both factors varying from one issuer to another (see more on this below), but the signs and relevance tend to be consistent. As such, both volatility and liquidity appears to be important drivers of the shrinking of the Bund greenium since the start of the year.
The 3y German government bond seems to be the exception to the rule. This seems related to the recent shortage of collateral of short-dated high-quality bonds, which seems to have hit the non-green bond the most. As a result, the 3y Bund greenium is now trading above 9bp, which is significantly higher than the average greenium of 4bp across all other green bonds. It has also made the 3y greenium the most volatile, as shown in the graph below.
But what explains this tighter liquidity in the German green bond space?
Of course, the significantly lower amount outstanding for those bonds compared to conventional ones is one factor. For example, while the amount outstanding for the 3yr non-green German bund is EUR 25bn, this is only EUR 5bn for the green one. It still represents a relatively small market, and for being a “niche market”, liquidity is also naturally lower. Furthermore, this lower liquidity could also be due to the type of investors buying those bonds. Indeed, sovereign issuers tend to issue between 10 to 30 years dated bonds, and we see similar duration for the green bonds as well. As such, we could assume that investors interested in sovereign green bonds have a long-term focus, such as pension funds. Thus, investors would tend to hold those bonds until maturity which then, makes them less often traded in the secondary market. In any case, investors in green bonds tend to be relatively more buy-and-hold investors.
Semi-core: different drivers for the greenium
Following our findings that the greenium for Germany is partly driven by liquidity (that is, less liquidity resulting in lower greeniums), we have tried to validate whether this could also be a driver for semi-core EU sovereigns, such as France and Belgium.
We look at the French green sovereign bonds maturing in 2039 and 2044, as the other outstanding green bond from the country (maturity in 2038) is an inflation-linked bond. This bond has also been issued this year, which leaves limited historical data for a proper analysis. For the same reason, we also exclusively look at the Belgium green sovereign bond maturing in 2033. For the greenium calculation, we compare the yield of these green bonds with the French governments bonds (OATs) maturing in 2040 and 2048, and the Belgium government bond maturing in 2034, respectively. This assures that the difference in duration is less than one year for all bonds, except the OAT green 2039 (duration difference is 2.3y, although still less than 1y when looking at years to workout).
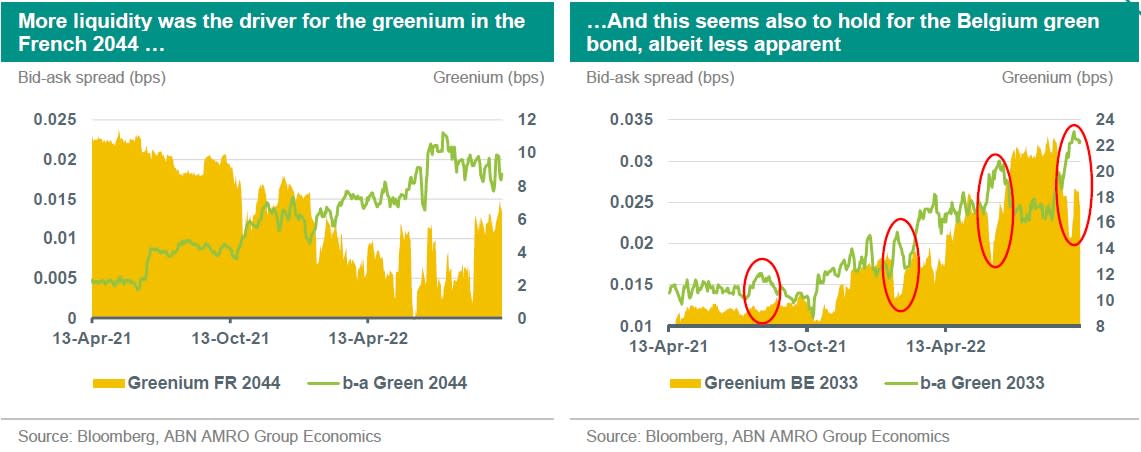
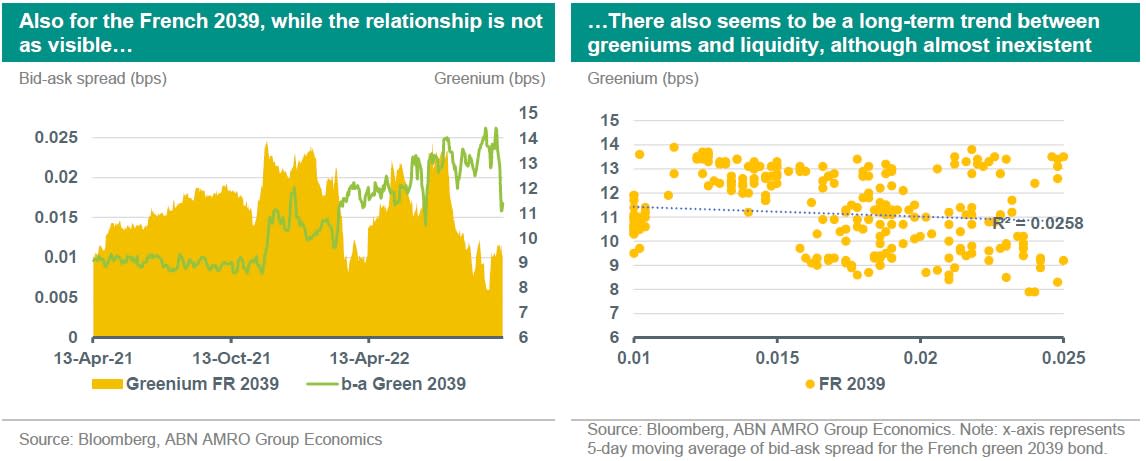
Firstly, we assessed whether the greenium is related to liquidity, hereby proxied by the bid-ask spread for the green bonds. As shown in the charts below, this correlation (shrinking greenium when liquidity is lower) is clearly visible for the OAT 2044 bond. For the Belgium green bond, the relationship seems to only hold once there are spikes in the bid-ask spread, as highlighted by the red circles within the chart. Interestingly, however, is that liquidity for this green bond has worsened over the course of last year, while the greenium has steadily increased. The green OAT 2039, however, seems to be a bit of an exception to this rule. Although under a long-term trend one might derive a small correlation between liquidity and greeniums (see bottom chart on the next page on the right hand side), the impact of liquidity on greeniums is significantly less apparent than with the other two green bonds (OAT 2044 and Belgium 2033). One reason for this might be due to the fact that – as we previously pointed out – the comparable bond used for the greenium calculation in this case had a difference in duration of 2.3 years (which is below 1y for both the OAT 2044 and the Belgium 2033 green bonds). Hence, the greenium in this case might have less to do with liquidity, and more instead with other factors, such as the investors’ aversion to duration.
Although not depicted in the charts above, we would like to highlight that the argument that green bonds tend to be less liquid than their non-green comparable bonds does not fully hold in the semi-core space. For example, the French 2039 green bond trades consistently at lower bid-ask than the non-green 2040. However, we attribute this to be exclusively due to the difference in outstanding amounts. For bonds in which the outstanding amount is higher (regardless of green or non-green), we observe lower bid-ask spreads.
What role does volatility play?
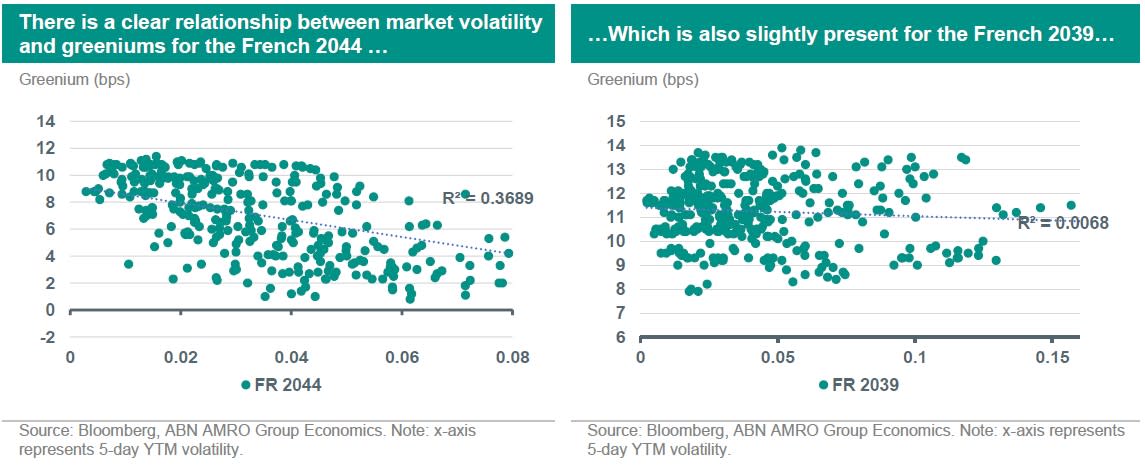
We now turn to volatility as explanatory factor for greenium of sovereigns. This was calculated by taking into account the 5-day variance between yields to maturity. As shown in the charts below, there is a clear relationship between realized volatility and greeniums for the French 2044. In this case, we can see that the higher the volatility, the lower the greenium. One explanation could be that once the market is in distress, and there is more volatility in yields, investors become less distinctive between green and non-green bonds, and this results in a lower greenium. That is, investors are less willing to accept a lower price for a green bond. Nevertheless, we would like to highlight that even under these conditions, the greenium still seems to be present. This relationship also holds for the French 2039 bond, although again, not as firmly as with the French 2044, as evidenced by the lower R-square.
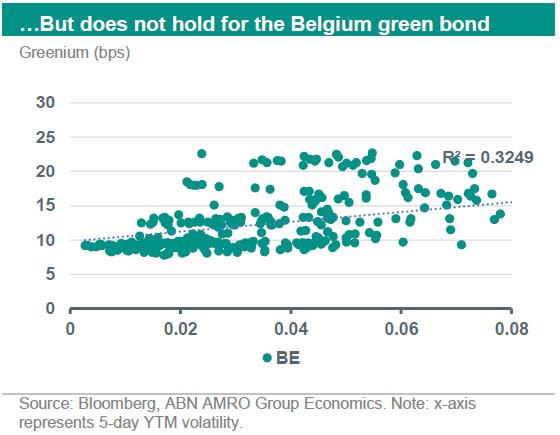
Interestingly, however, this does not hold for the Belgium green bond. In fact, the relationship between volatility and greenium is actually the opposite in this case. That is – the higher the volatility, also the higher the greenium. And that seems to be supportive with the fact that the Belgium greenium has been on the rise since the de-coupling in sovereign greeniums started to take place at the start of this year (see chart on page 2). While all other sovereigns (Germany, France, and the Netherlands) saw their greenium decrease over the past few months, the opposite seems to be true for Belgium. A potential reason for that is the fact that the Belgium green bond has a lower maturity (2033) than the Dutch (2040) and the French (2039 and 2044) green bonds. Hence, as it is with the 2025 German green bond, it could be that the lower duration of the bond plays a role. However, given the lack of historical data over green bonds in Belgium’s curve, it is at this point however not possible to test this hypothesis.
Conclusion
Our analysis shows that liquidity and volatility seem to be explanatory factors for the movement in greeniums of sovereign bonds. In the case of Germany, with exception of the 2025 green bond, it seems to be consistent that higher bid-ask spreads are translated into lower greeniums. Hence, worsening conditions in terms of liquidity have also a negative impact on the German greenium. In the case of semi-core sovereigns, we find that the higher bid-ask spreads seem to also impact the greenium of the French green bonds, although to a lesser extent in the case of the French 2039. In the case of Belgium, this only seems to hold once we see short “peaks” in bid-ask spreads, which have then an immediate impact on greenium. In the long-term, however, we do not see an influence of worsening liquidity in the Belgium greenium.
Furthermore, we also conclude that volatility can play an important role. Although there should, in theory, be a relationship between bid-ask spreads and volatility, that is not necessarily always the case, which allows us to distinguish the impact of both variables on the greenium. Once volatility increases, we see that the greenium for the German and French bonds is negatively impacted. This does not seem to hold for Belgium, though and further research is needed to clarify this.
