Sustainaweekly - The implications of the ECB greening its bond portfolio

We kick-off this edition of the SustainaWeekly by taking a closer look at how the ECB intends to green its Corporate Security Purchase Programme (CSPP). We try to replicate its proposed climate scores for issuers to analyse what the impact will be for companies. Also the beneficial treatment that green bonds will have in the primary market might not be applicable for all issuers. Our second topic is an overview of the Dutch Cabinet’s proposed Climate Fund. While the fund is expected to only formally enter into force in 2023, the Cabinet already wants to release part of its funds to tackle several climate issues. Finally, we take a closer look at how the ABN AMRO Transition Commodity Price Index has performed on the course of the last few months. We see that many base metal prices as well as the prices of many minor metals declined strongly from the peak in May 2022, mainly caused by cyclical trends. This has a positive impact in material costs for low-carbon technologies.
Strategist
The ECB has released more details on how it intends to green its CSPP portfolio and this will be mainly done through calculation of climate scores. We can expect the largest tilt to take place in both very high and very low-scoring companies. The sectors with largest variability in scores are utilities, energy, real estate and communications. Also the green bond criteria can prove to be a challenge for issuers.
Economist
The Dutch Cabinet published the 2023 budget and this included attention to climate policy. Besides more ambitious targets for 2050, it has also disclosed it will commit EUR 35bn by 2030 under its Climate Fund. The fund will only come into effect in 2023 but the Cabinet is already releasing EUR 2.1bn for immediate actions.
Sectors
The ABN AMRO Transition Commodity Price Index has fallen by 22% in the past 21 weeks. This is driven by shocks in the global economic cycle but also interest rate hikes in the US, which drive the strength of the US dollar. For many low-carbon technologies, this means that also material costs have decreased as a result.
ESG in figures
In a regular section of our weekly, we present a chart book on some of the key indicators for ESG financing and the energy transition.
-------------------------------------
Various issuers not sufficiently prepared for the greening of the ECB’s CSPP
The ECB has released more details on how it intends to green its CSPP portfolio.
Issuers will be assigned climate scores, which will be calculated on the basis of 3 factors: (i) backward looking emission performance; (ii) forward-looking emission targets, and (iii) the quality of climate disclosures.
Our analysis indicates that largest ‘tilt’ will take place within both, very high-scoring (ie good) companies (the ECB will increase exposure significantly), and low-scoring companies (ECB’s exposure will reduce further)
We have therefore analysed which sectors have the largest variability in scores and would be therefore more exposed to the CSPP’s greening. We conclude that these are: utilities, energy, real estate and communications.
Also the criteria for green bonds leaves some companies exposed to the potential tilt, in particular the ones that have not included a pledge in the bond prospectus that a third-party assurance will be provided in the allocation of proceeds
This is a summary of our ESG Strategist publication “Various issuers not sufficiently prepared for the greening of the ECB’s CSPP”. The full piece includes as well individual issuer names that will be mostly impacted by the programme.
The ECB announced in July that it would start to direct (re)investments under its Corporate Sector Purchase Programme (CSPP) towards more climate friendly companies with the aim to decarbonise the corporate bond holdings (i.e. reduce exposure to climate harmful companies. What is more, the ECB also announced it would consider climate change indicators within the entire Eurosystem’s monetary policy framework, including also therefore its collateral framework and climate-related disclosure requirements for collateral, as well as its risk assessment and management. The ECB has various objectives under greening the CSPP, such as reducing financial risk related to climate change in its balance sheet, to encourage transparency by issuers, and to support the green transition of the economy.
While the original announcement came in July, it was only last week that the ECB provided more details on how it aims to decarbonise its corporate bond holdings (see ). In this note, we have briefly summarized the proposed methodology, as well as how the ‘tilt’ will likely be applied in practice. For more information on the proposed changes for collateral and risk assessment framework, please read our previous note .
What is the ECB’s proposal for decarbonizing its CSPP portfolio?
Firstly, the decarbonization of the ECB’s CSPP portfolio will occur in the form of a ‘tilt’, and that means that it will become underweight in carbon intensive companies and overweight in climate friendly ones, deviating therefore from the current market weighting that it assigns to companies. It will therefore not sell the bonds of issuers with low scores (at least, not at this point), but instead constrain further purchases of low-scoring issuers, which could even be eventually halted until they have become more climate friendly. To quantify for ‘climate friendliness’, the ECB will make use of climate scores, which will be calculated using its own methodology (see more details below).
With the ECB having stopped net purchases recently, the effects from tilting could take a long time to materialize. Still, corporate bond buys are an important part of the ECB’s toolkit and should the central bank decide to restart net purchases, the tilting could drive a price difference between low and high scoring issuers.
Furthermore, the ECB announced it will also not buy long-dated securities of issuers with low scores due to inherent physical and transition risks, which are more severe in the long-term. Issuer (group) limits will also be raised for higher (that is, better) scoring issuers (currently there is a maximum issue share limit of 70% per corporate bond on the basis of the outstanding amount, read more ). In the primary market, it will not only adjust bids to favour issuers with better scores, but it will also impose maturity limits on bonds from companies with a low-score (the exact limit was not disclosed).
Another interesting instrument the ECB will take into account when aiming to decarbonize its CSPP holdings are green bonds. The ECB announced there will also be a specific treatment for primary purchases of green bonds, which can also be potentially treated favourably if they fulfil the ECB’s identification process (more details below).
All of these measures will be in place as of 1 October 2022 and scores will be reviewed once per year. While climate-related information of the ECB portfolio will be disclosed in 1Q23 at earliest, the ECB has clearly stated it will not publish individual climate scores due to fears of undermining monetary policy objectives. The overall volume of corporate bond purchases will continue to be determined solely by monetary policy considerations.
The methodology for the ECB climate scores
Basically the ECB will take into account 3 factors when calculating an issuer’s climate scores: backward-looking emissions, forward-looking (emission) targets and level/quality of climate disclosures (see more details ). The applied methodology is based on the requirements set under the EU Regulation that defines EU Climate Transition Benchmarks and EU Paris-Aligned Benchmarks (see ).
What does this mean in practice?
Based on the aforementioned criteria, we have tried to replicate the ECB criteria in order to check what impact this could have for investors and issuers. For that, we have made use of the following assumptions:
All three factors have an equal weight in the final score (33.3%)
The quality of disclosures was assessed using the Bloomberg Environmental Disclosure Score on issuer level. For companies that do not have such a score, we have made use of Sustainalytics’ data. The “Company’s type of disclosure” (e.g. only scope 1 and 2, or scope 1, 2 and 3) was translated to an equivalent score using the Bloomberg Environmental Disclosure Score methodology.
Backward-looking and forward-looking emissions were accounted for by using as a proxy the Sustainalytics’ carbon risk score. These take into account not only existing (historical) emissions but also how well the company aims to decarbonize. This includes not only whether (and which) targets / commitments are in place, but also future and past actions and outcomes of the company. These scores are also compared across industry, which we find interesting given the ECB’s similar approach1. However, we do note that a limitation of our approach is that we do not compare carbon risk scores across the entire corporate universe, which will be also applied by the ECB.
Lastly, we have also included within our methodology whether (i) a company has a net zero target in place and (ii) whether the company has targets in place which are science-based. For the latter, we have used the Science-Based Initiative (SBTi) as proxy.
Results of our analysis have been presented below.
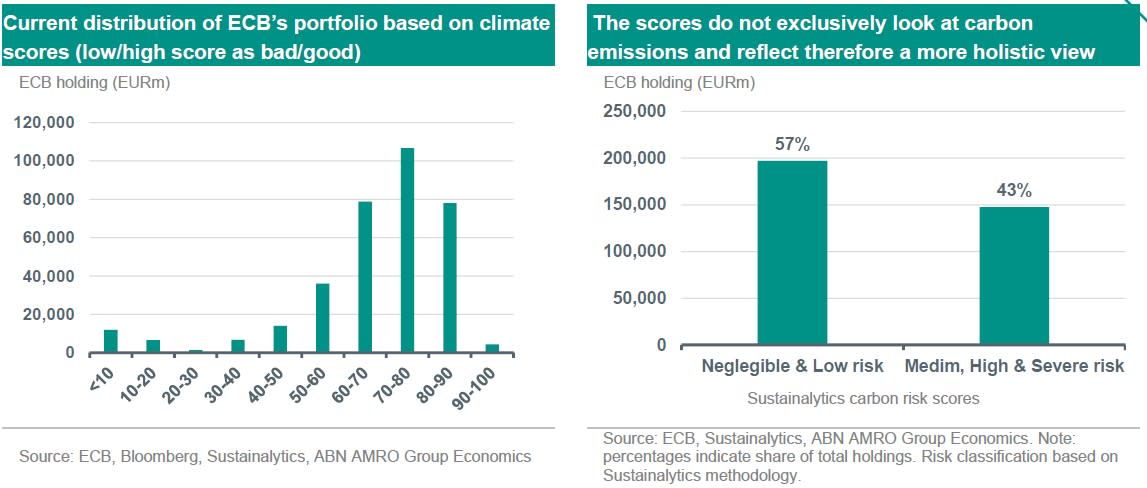
As we can see, the ECB is already relatively underweight in low-scoring companies. However, one would expect the distribution to be fully skewed towards the right (a higher share of scores between 90-100) once the ECB has achieved its goal in greening the corporate bond portfolio. Hence, it is likely that the largest ‘tilt’ will take place within both, very high-scoring companies (the ECB will increase exposure significantly), and low-scoring companies (ECB’s exposure will reduce further). We would also like to note that by analysing the graphs above we can see that the ECB climate scores will reflect a more holistic view of companies’ climate actions, and will therefore not necessarily penalize carbon intensive companies. Certainly, this is one of the components of the score, but a carbon-intensive company that has high quality of disclosures and strong decarbonization plans could very well score high according to the ECB methodology.
We have also assessed which sectors have both: the lowest-scoring companies and the highest-scoring companies, as we ultimately see no value-added in only looking at the average scores across sectors to evaluate the tilt. For example, a quick look at the chart below on the left hand side would potentially lead us to the conclusion that the ECB will reduce exposure to energy, utilities and real estate, and increase exposure to technology, materials and health care. However, as the ECB will no longer look at sectors to determine the weight of exposure within its portfolio, but instead at individual companies, average climate scores across sectors does not allows us to draw such conclusion. In particular, if we compare for example the technology and the utilities sectors on the chart below, we can already see that currently, there are not many bonds from the technology sector in the ECB portfolio. For utilities, however, this is the complete opposite: this is the sector with the largest number of bonds being held by the ECB at the moment. Hence, dispersion of scores within utilities is more likely than in technology – and that will be key for the programme tilt.
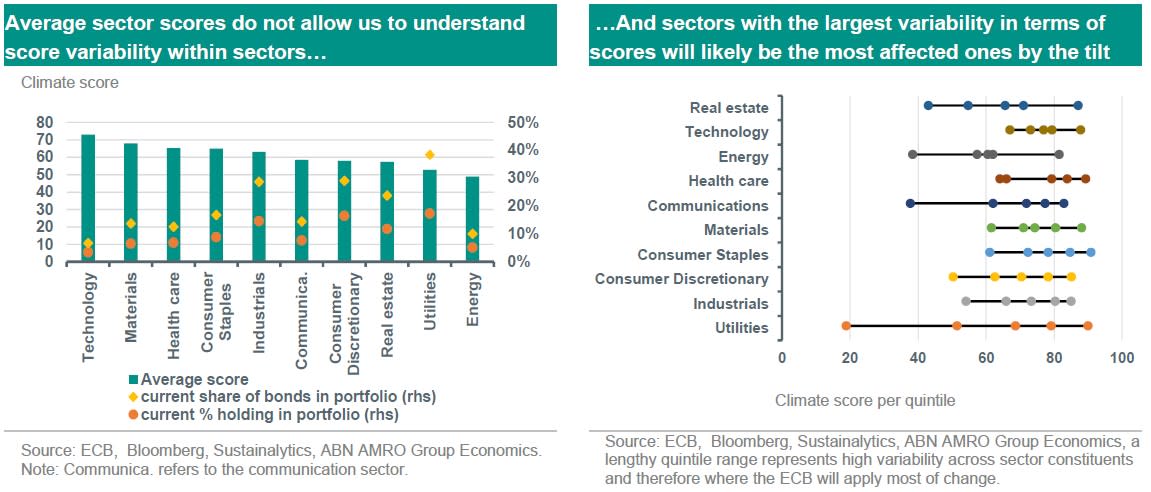
To get a better understanding of this, we have therefore separated scores within sectors based on quintiles. This allows us to check which sector has the best performing companies in terms of climate scores, and which one has the lowest scoring ones. Moreover, the divergence in terms of quintiles allows us to check which sectors are the most exposed ones, as a low variability in the sector will also likely result in a low impact from the ECB’s tilt.
As shown in the chart above on the right hand side, we can see that the most exposed sectors are (in this order): utilities, energy, real estate and communications. While, on the other hand, there is significantly low variability within technology and health care, and these will also likely be the least affected ones. Nevertheless, from the chart above we can also see that there are high scoring companies within utilities, consumer staples and health care, and we can therefore expect the ECB to become overweight within these companies.
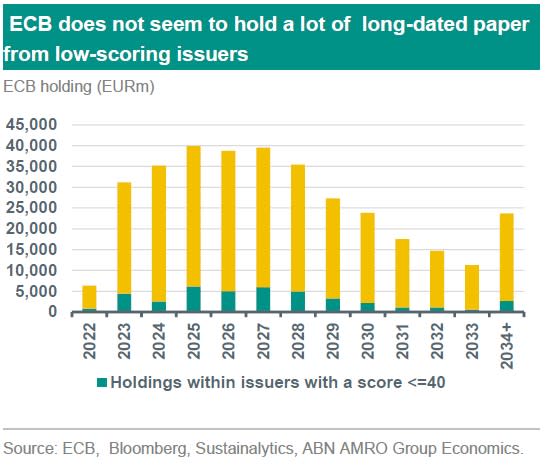
Another important point of consideration is the fact that the ECB has announced it will impose maturity limits from low issuing scores. That means that it will halt purchases of long-dated securities coming from companies with a low climate score. While the exact threshold has not been disclosed by the ECB, we have below included a breakdown of ECB’s current portfolio based on maturity and climate score. We have assumed that companies with a climate score below 40 will be likely penalized, but ultimately the halt will be within the extremely low scores (e.g. zero). The chart below suggests that at the moment the ECB does not hold a lot of long-dated paper from issuers that have a score below 40 (which we classified as ‘low-scoring’ issuers). If we assume that long-dated paper is any bond with a maturity higher than 10 years, then actually only around 1% of the current ECB holdings will be affected.
Green bonds
While the tilting is focused on reducing climate-related financial risks in the CSPP portfolio, the ECB acknowledges the importance of green bonds in funding climate transition – hence the decision to also prioritize investment in those bonds in future purchases. This ultimately means that the ECB will not only look at climate scores when assessing investments in the primary market, but also the label of such bond, and more specifically, whether it carries the green bond label or not.
However, the ECB notes that while it intends to give favourable treatment for those bonds in primary market bids, aggregate purchases by issuer will continue to follow the tilted benchmark (that is, portfolio overweight based on climate scores).
Given that the EU Green Bond Standard (GBS) is not in place yet, the criteria for green bond investments are as follows:
The issuer green bond framework needs to align with leading market standards, such as the ICMA Green Bond Principle (GBP) or the Climate Bond Initiative;
A Second Party Opinion (SPO) on such framework needs to be in place; and
The bond prospectus needs to clearly state that a third-party (e.g. an external auditor) will assure the (allocation of) use of proceeds until full allocation.
While we acknowledge that the first and second criteria do not seem challenging – that is, most of the green bond issuers in the European market have nowadays a Framework that aligns with the ICMA GBP and an SPO, we see the largest challenge coming from the third criterion.
That is because the most widely used market-based green bond standards, such as the ICMA GBP, there is no mandatory requirement to include information on the intended allocation (i.e. the use) of proceeds of the bond in the prospectus. That also means that they are not considered liable if they breach those obligations.
To assess whether that is true, we have quickly looked at the companies with the largest amount of green bonds within the current ECB portfolio. That leads us to the following top 10 issuers: TenneT, Engie, Gecina, CTP, Covivio, EON, Merlin Properties, Volkswagen, Iberdrola and RWE. We conducted a (limited) analysed into whether the prospectus of these companies include a clause stating that a third-party will assure the allocation of use of proceeds. According to our findings, 5 out of the 10 companies currently do not have a “pledge to the effect that a third-party assurance on the use of proceeds is foreseen”. Applying the same share (50%) to the entire green bond universe would ultimately mean that only 50% of the green bonds currently held by the ECB would receive a special treatment in the primary market. The ECB’s criteria would then essentially narrow the universe because of interpretation differences. A quick fix is at hand by either a more flexible approach from the central bank on the criteria or a quick remediation in the prospectus by issuers. We find the latter to be more likely.
We would like to also highlight that while EU GBS is not used as criteria, one could expect it to be part of the ECB methodology once it is in place. As the ECB itself notes “The EUGBS is expected to become a leading standard for green bonds, enabling companies and public bodies to raise large-scale financing more easily for climate and environmentally friendly investments, while protecting investors from greenwashing”.
-------------------------------------
1 Sustainalytics applies a range between 0 and 100 in their scoring, with 0 being the best and 100 being the worst. We reversed the Sustainalytics scores to align with the Bloomberg disclosure score, which allows us to calculate the overall score.