Still a long road to go for EU banks to become greener and less exposed to transition risks

Using the Capital Requirements Regulation (CRR) Pillar 3 reports by banks in the EU, we assess their loan portfolios’ exposure to sectors that highly contribute to climate change, their “greenness” as well as their transition risk. We conclude that within the sample analyzed, 70% of the loan exposure of European banks is towards sectors that highly contribute to climate change, with particular concentration towards real estate (27%) and manufacturing (13%). In line with that, banks disclose that, on average, a mere 0.7% of the loan exposure is towards activities that substantially contribute to climate change mitigation. At the same time, there does not seem to be much difference between the average maturity of loans towards sectors that highly contribute to climate change and the average maturity of the loan book. Using the Alessi et Battiston (2023) methodology, we also calculate these banks’ Taxonomy-alignment coefficients (TAC) and Transition-exposure coefficients (TEC). Our analysis indicates that Nordic banks have a higher TAC when compared to the remaining of the sample, indicating a higher “greenness”, but also a higher TEC, contradictorily indicating a higher exposure to transition risks. The above highlights the importance of distinguishing between a bank’s existing “greenness” and their exposure to transition risks.
Under the Capital Requirements Regulation (CRR) Pillar 3 requirements, banks and other financial institutions in the EU are required to disclose certain information regarding their risk management practices, capital adequacy, and risk exposures. Since recently, these also include ESG considerations, whereby banks need to disclose how environmental, social, and governance factors influence their overall risk profile and sustainability practices. In 2023, the ECB concluded that several banks still lagged in terms of both the availability and the quality of these ESG disclosures and that these issues needed to be addressed by the end of this year, with the risk of periodic penalty payments being imposed to those that do not meet the supervisory expectations (see ). As banks disclosed new ESG information following the publication of the 2023 Pillar 3 reports, we look at the most recent disclosures in order to assess what conclusions can be inferred so far from the data being reported.
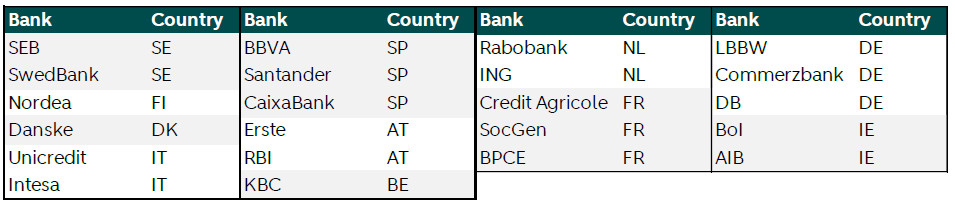
In terms of universe, we have selected the corresponding largest banks of the following regions: the Netherlands, France, Germany, Austria , Italy, Spain, Belgium, Nordics and Ireland. In total, our sample comprises 24 banks, of which 2 do not report yet on ESG information in their Pillar 3 reports. That leaves us with a sample of 22 banks, as shown below:
EU banks largely exposed to sectors that highly contribute to climate change
The EBA, responsible for putting forward templates associated with the CRR Pillar 3 disclosures around ESG risks, requires banks to disclose the gross carrying amount (GCA) of loans according to pre-defined sectors (NACE codes). EBA has then buckled up together the sector that are classified as “highly contributing to climate change”, as specified in the EU Commission Delegated Regulation (EU) 2020/1818.
Within the sample analyzed, it is possible to see that on average a whopping 70% of the loan exposure (GCA) is towards sectors that highly contribute to climate change. From these sectors, exposure is concentrated towards real estate (27%) and manufacturing (13%), which are obviously asset heavy sectors and typically fund themselves with more debt. That being said, we note that the banks’ concentration towards sectors that highly contribute to climate change does not necessarily reflect the state of the economy. That is because “services” account for a significant share of the EU economy’s gross value added (over 70% in 2020), but does not rely heavily on debt, given its asset-light nature.
Certainly, not all of the companies that operate in the sectors that highly contribute to climate change can be deemed as unsustainable. Hence, we also evaluate the banks’ disclosures on how large is the loan book exposure towards environmentally sustainable activities (defined as ‘substantially contributing to climate change mitigation’ as per the EU Taxonomy). Here we can see that only a mere 0.8% of the loan exposure is towards these activities. Within real estate and manufacturing (the two highly-contributing sectors where banks have their largest exposure), we see that only 0.4% and 1.5% are considered to be sustainable activities, respectively. Overall, banks disclose that, on average, only 0.7% of their loan book is towards activities that substantially contribute to climate change mitigation.
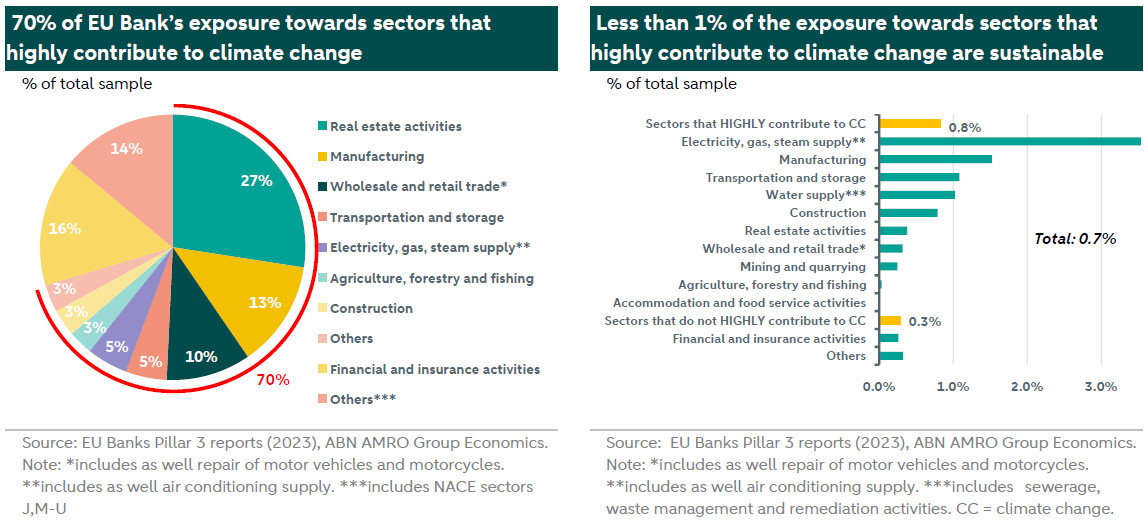
From the chart above on the left, it is also possible to see that the exposure towards the electricity supply sector (and, to some extent, the one towards manufacturing) is driving this average up. Interesting therefore to see that this seems to be one of the sectors where the largest share of sustainable activities can be found.
Furthermore, banks now report on the amount of exposure which is towards counterparties that are excluded from the EU-Paris aligned benchmarks. These include companies that derive:
1% or more of their revenues from hard coal and lignite; and/or
10% or more of their revenues from oil fuels; and/or
50% of more of their revenues from gaseous fuels or from electricity generation that has a GHG intensity of more than 100g CO2e/kWh
Within the data analyzed, we see that 2.8% of the overall loan exposure are those companies that fit the aforementioned exclusions. Without surprise, we see that this is mostly directed towards sectors that highly contribute to climate change. In total, 3.7% of all the exposure towards these sectors is towards clients that are excluded from the EU-Paris aligned benchmarks.
Almost all financed emissions come from sectors highly exposed to climate change
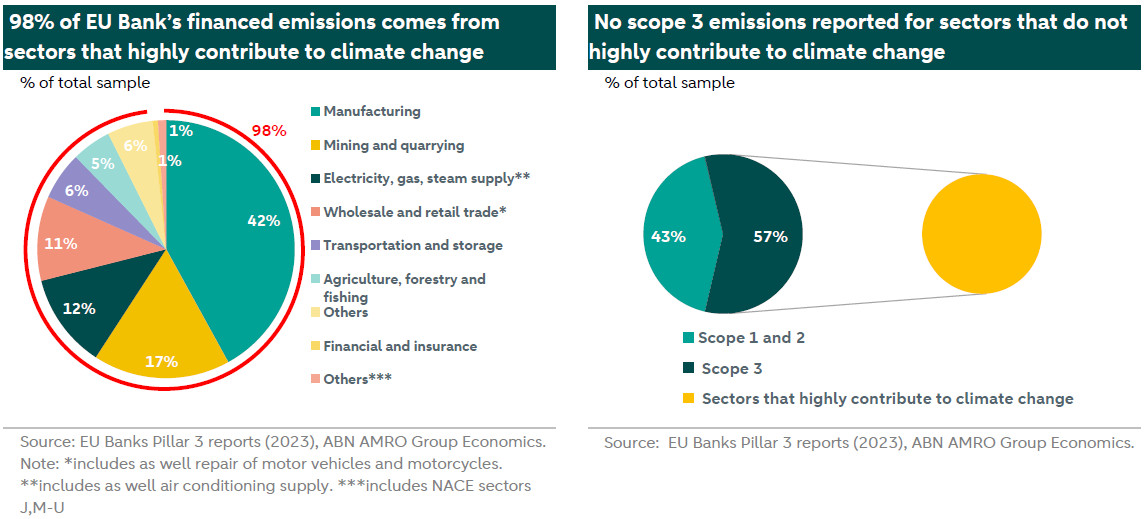
Banks are also required to report, per sector, the amount of GHG financed emissions (scope 1, 2 and 3 emissions) of their clients. Our analysis shows that 98% of the total financed emissions come from sectors that highly contribute to climate change. More specifically, 42% of the loan book emissions of banks are from financing the manufacturing sector. Interestingly, the real estate sector contributes to only 1% of the total loan book emissions.
Furthermore, when banks are able to estimate the scope 3 emissions of their counterparties, they also need to report the share of the financed emissions that are coming from their clients’ scope 3 emissions. In this case, nearly 100% of all scope 3 financed emissions are coming from the sectors that highly contribute to climate change. This also means that banks are now reporting that scope 3 emissions of clients that operate in the financial and insurance sectors are zero, which likely means that they do not feel comfortable just yet estimating other financial institutions financed emissions or that they do not yet fully rely on the information that is being reported.
No significant difference in average maturity for loans towards sectors that highly contribute to climate change
In terms of the average weighted maturity, exposures towards sectors that highly contribute to climate change do not seem to have a significantly higher maturity than the remainder of the bank’s loans. The average weighted maturity for these exposures is 5.07 years, while this is 4.82 years for the sectors that do not highly contribute to climate change. Overall, more than 70% of the loan exposure towards sectors that highly contribute to climate change have a maturity of less than 5 years. While this could be an indication that banks have the flexibility to reduce exposure to these sectors in a fairly short timeframe, important to highlight that were all banks decide to not refinance their exposure due to climate reasons, the borrower’s credit quality might be in jeopardy, which can also then negatively impact the bank. Interestingly as well, 11% of the loans towards sectors that highly contribute to climate change have an average weighted maturity of over than 20 years. However, this long-term exposure seems to be mainly driven by real estate exposure, which indeed have a longer maturity. In fact, real estate is also the sector with the highest average maturity, which is 6.8 years.
Banks still highly exposed to transition risks, with a low share of “green” loan portfolios
Following the methodology applied by Alessi et Battiston (2023), we map the economic sectors disclosed by banks to the authors’ standardized Taxonomy Alignment Coefficients (TAC) and standardized Transition-risk Exposure Coefficients (TEC) (find the authors’ full methodology). These metrics allow us to estimate the overall “greenness” of bank’s portfolios, as well as exposure to transition risks, respectively. More specifically, the TAC is calculated by estimating (based on NACE sectors) the share of investments that are aligned with the EU Taxonomy. It is important to highlight that, given the practical impossibility to estimate alignment with ‘do no significant harm criteria’ (DNSH), the TACs only refer to the ‘substantial contribution’ (SC) component. With regards to the TEC, the authors provide standardized coefficients to each NACE sector reflecting the transition potential of each activity. A higher TEC would indicate a higher exposure to transition risks.
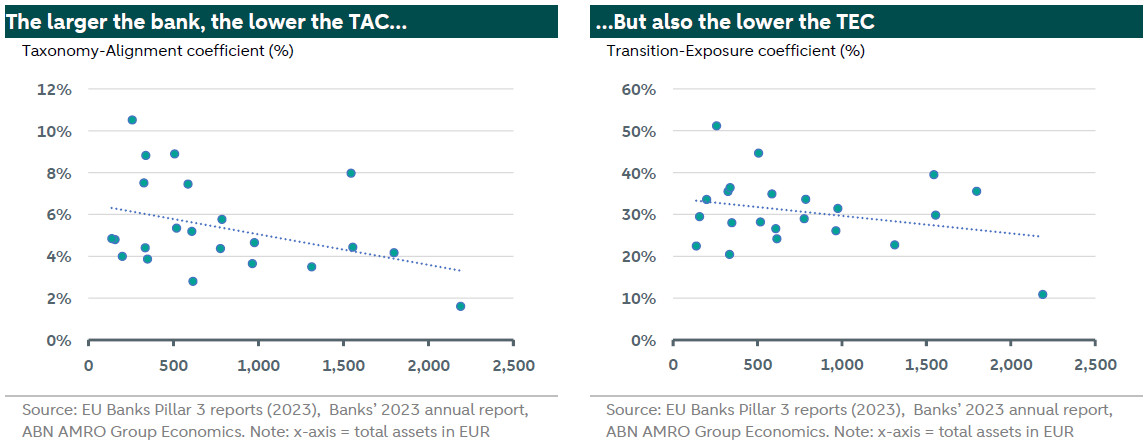
Based on this, our analysis indicates that the average TAC within our sample is around 5%, which is significantly higher than the 2% estimated by Alessi et Battiston. With regards to transition exposure, our sample indicates an average TEC of 31%, which is almost double the 21% estimated by Alessi et Battiston when considering only EU-level data. Clearly, our sample seems to be biased towards the banks that have higher transition exposure, but are more “green” as proxied by the authors’ “greenness” coefficient. One factor that could explain this difference is the fact that our analysis considers only a sample of banks in Europe, not the entire universe. As shown in the charts below, by plotting the estimated TACs and TECs against the banks’ sizes (proxied by their total assets), it is possible to see that size seems to negatively influence the share of green assets (lower share of green assets) but positively influence TEC (lower transition risk exposure). Hence, the fact that our analysis yields a higher TAC and a higher TEC compared to the research conducted by Alessi et Battiston could be an indication that we exclude very large banks from our analysis. This could be explained by our exclusion of UK and Swiss (mainly UBS) banks.
Another possible explanation for why our coefficient differs from the one estimated by Alessi et Battiston is our focus on only selected countries in the EU. Once again, our analysis could be biased towards countries where exposure to sectors that highly contribute to climate change is higher, due to economic drivers (such as power generation and manufacturing in Germany).
The figure below shows the breakdown of TEC and TAC for each bank in our sample. By looking at the TAC coefficient, we see that Nordic banks have a “greener” portfolio. What seems to be driving this is these banks’ large share of commercial real estate (CRE) within their total loan book, which, albeit receiving a small TAC as per Alessi et Battiston, drives the overall TAC of the portfolio higher. That is also due to the fact that majority of the other sectors that highly contribute to climate change are assigned a TAC of zero.
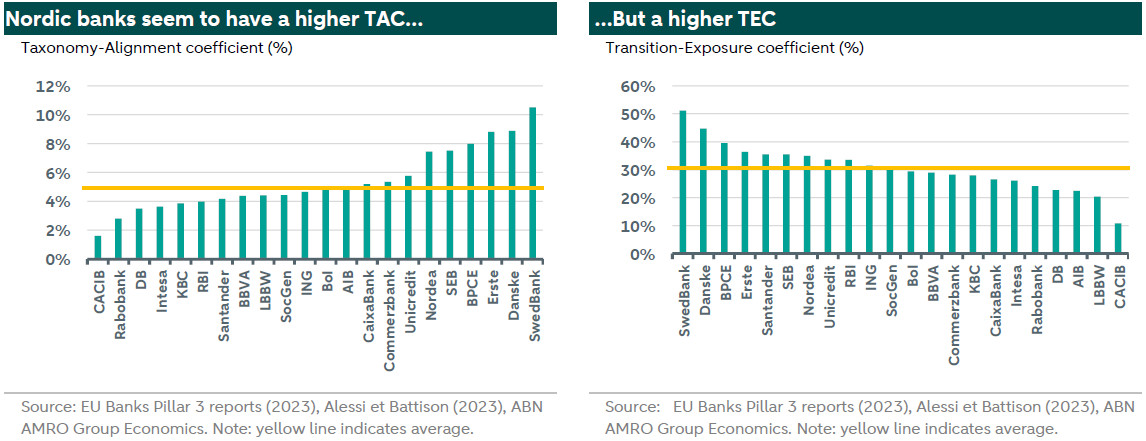
Contradictory to this is however the fact that the same Nordic banks also have a higher TEC, indicating higher transition risk, indicating that there is a mismatch between a bank’s “greenness” and its exposure to transition risks. This is in line with Alessi et Battiston (2023) conclusions. According to these authors, this is usually the case when the bank is exposed to sectors that are “at the same time comparatively greener and particularly exposed to transition risks”. This is the case with, for example, the activity “electricity production”, or “steam and air conditioning supply” (relatively high TAC, but low TEC). According to Alessi et Battiston (2023), the TEC for the activity “steam and air conditioning supply” is proxied by the share of the derived heat that comes from fossil-fuels in the EU (39%), while the TAC is proxied by the share of renewable energy used for heating and cooling in the EU (21%). In this case, this activity has a relatively high share of Taxonomy-aligned activities (proxied by the share of renewable energy), but is still subjected to relatively high transition risks arising from the fact that the derived heat in the EU is produced by a relatively high share of fossil fuels.
The above highlights the importance of distinguishing between a bank’s existing “greenness” and their exposure to transition risks. More specifically, that “greenness” does not provide a direct assessment of risk and that, given that, a bank can be simultaneously green, and yet exposed to transition risk. Nonetheless, as specified by Alessi et Battiston (2023): “an increased volume of green lending instruments is key to ensure that high-carbon counterparties proceed in their transition and hence decrease their exposure to transition risk”.