ESG Economist - More consistent climate tax policies are necessary for the transition


On 1 July 2023, the Dutch Government raised the excise tax on fuels, reversing the cut in 2022. The former exacerbated the price difference between Dutch and German fuel by 14 cents per litre. This note examines whether Dutch households living near the German border responded differently to this policy change compared to households in the rest of the Netherlands. The findings reveal that households in the border region decreased their consumption of Dutch fuel more than households in the rest of the country by an additional 3.6 litres, per week. This suggests that people in the border region are more sensitive to relative fuel prices. When policies are not aligned, people (partly) shift their consumption towards the lower tax country. As we approach 2030, the first deadline for EU emissions’ reduction targets, aligning climate tax policies is important for effectively reducing emissions.
In 2030, the EU faces the first deadline for CO2 emissions reduction targets. The EU's climate targets for 2030 require member states to reduce greenhouse gas emissions by at least 55% from 1990 levels. To meet these goals, road traffic emissions need to be reduced or replaced with less-polluting alternatives, such as public transport or electric vehicles. In 2022, data from CBS indicated that CO2 emissions from road traffic accounted for 17% of the Netherlands' total CO2 emissions, amounting to 26.9 billion kilograms. Of these emissions, passenger cars were responsible for 57%, equating to 15.3 billion kilograms of CO2 for that year.
One strategy employed by member states to discourage the use of combustion engine cars and promote cleaner transportation is taxation. For example, increasing fuel taxes makes driving combustion engine vehicles more costly. However, if climate tax policies are not aligned between the EU countries, residents living near the border can potentially shift consumption towards the lower tax country.
Estimates suggest that around six million people lived near the Dutch borders in 2023, approximately one-third of the Dutch population. Focussing on households within 10 kilometres of the border reduces this number to about two million, close to 13% of the Dutch population. Therefore, the behaviour of this group can be significant and is important to understand.
This analysis leverages a policy-driven relative price change to enhance understanding of displacement effects in the border regions. These findings aim to assist policymakers going forward. As climate change becomes increasingly pressing and with the EU emissions reduction targets approaching increasing incentives for all countries to transition becomes ever more critical.
Policy-driven shift in fuel prices
In 2022, both the Netherlands and Germany implemented fiscal policies to address the high energy prices, including reducing excise duties on fuels. The Netherlands introduced this measure first on April 1, 2022, and maintained it until July 1, 2023, when it was partially reversed (see here). In contrast, Germany's excise duty cut only lasted for three months in 2022: June, July, and August. These differing timelines led to policy driven changes in the relative prices of Dutch and German fuel over time.
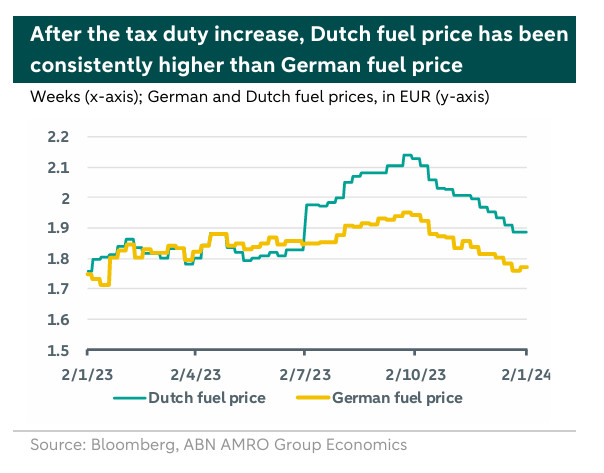
Historically, there have always been fuel price differences between the Netherlands and Germany. Prior to the energy crisis, German fuel had always been cheaper. However, due to the different policy responses, the price of Dutch and German fuel was rather similar during the first half year of 2023. The reversal of the Dutch excise duty reduction on 1 July 2023 effectively made Dutch fuel 14 cents per litre more expensive than German fuel.
This topic has been studied in the past…
We are not the first to study the effect of relative price differences on fuel consumption in the border regions. Several researchers have explored this topic in the past, with regards to different European countries. For instance, by the Swiss Federal Institute of Technologies studied fuel tourism in Switzerland during the period 1985–1997. It finds that a decrease of 10% in the Swiss gasoline price leads to an increase in demand in the border areas of nearly 17.5%. Moreover, the figures indicate that fuel tourism accounted for about 9% of overall gasoline sales in the three Swiss border regions during that period, suggesting that a CO2 tax might eliminate net fuel tourism – which would ultimately support the climate transition.
The France-Germany border was also subject to a more recent study using bank transaction data. Results suggest that when relative prices increase by 1%, the relative cross-border demand decreases by 7.7%. The authors conclude that this empirical evidence illustrates the importance of coordinating tax policy within EU. Finally, the Dutch Ministry of Finance conducted a similar research after the Dutch government reduced the excise duty on 1 April of 2022 (access to here, in Dutch). Findings suggest that after the excise duty reduction in the Netherlands, more litres of gasoline and diesel were sold in the border region compared to the inland. After the excise duty reduction in Germany, fewer litres of gasoline and diesel were sold in the German border region compared to the inland.
In this note, we explore this topic by using pin transaction data instead of sales data provided by gas stations across the Netherlands (as conducted by the Dutch Ministry of Finance). As such, we aim to investigate whether similar conclusions also apply when analysing the “fuel tourism” from a consumer perspective, rather than a supplier perspective. Additionally, we aim to disentangle the total effect on fuel consumption of the tax increase from the influence of living close to the German border.
We rely on pin transaction data to calculate the effects of the policy change
Our research relies on anonymous pin transaction data* from retail banking accounts at ABN AMRO. Please revert to the appendix for a detailed explanation of transaction data and the filters applied. Our panel data includes weekly fuel consumption of over 75.000 Dutch households in 2023. We split the households in two groups: those who live close to the German border and those who do not live on the border region. We define border-region as the region within 10 kilometres of the German borders. The non-border region corresponds to the remainder of the Netherlands that does not meet the former criteria. We rely on to establish both regions. To gain a more comprehensive understanding of fuel consumption, rather than focussing solely on expenses, we use Dutch fuel prices from Bloomberg (as plotted on the graph on the previous page) as a proxy to estimate fuel consumption. By dividing the transaction amount by the proxy price per litre, we can approximate the number of litres purchased.
To estimate whether households living near the German border respond differently to the excise tax increase compared to households in the non-border region we utilize a Difference-in-Difference (DID) approach. Households living in the border region are the treatment group and the non-border region act as the control group. This leads us to formulating the following DID:
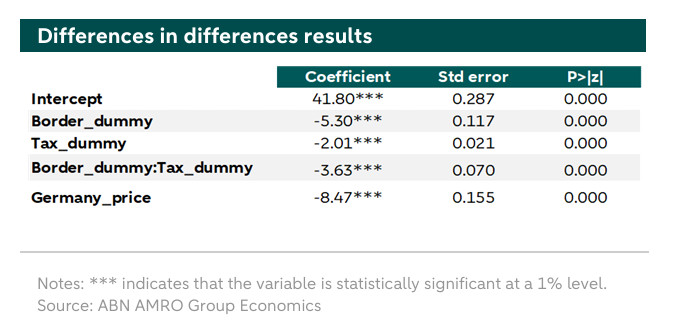
where Fuel_NL denotes fuel consumption in the Netherlands, Border_dummy takes the value of 1 if a household lives within the border region and 0 otherwise. The Tax_dummy is 0 prior to the date of the excise tax increase (01-07-2023) and 1 after that. The interaction term between the Border_dummy and the Tax_dummy is our variable of interest. This variable captures the effect of living close to the border on gasoline consumption in the Netherlands, excluding the effect of the tax increase per se. Additionally, we add a control variable, δ_t, representing the price of German fuel. Incorporating the price of German fuel allows us to account for demand variations resulting from price fluctuations. We assume that the market price movements between the Dutch and German markets are highly correlated. Consequently, this variable captures the changes in demand driven by price alterations. This captures the general fuel price developments and its developments on demands.
Consumers living closer to the border, drive to Germany to fill their tanks
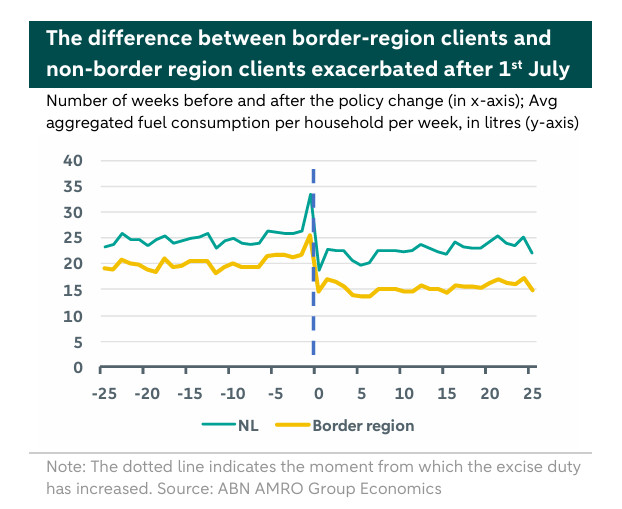
On the graphs below, we plot the average weekly fuel consumption of Dutch households six months prior to the policy change and six months post the policy change.
The chart above shows that even before the excise duty had increased (which corresponds to week 0 in the graph), there was already a noticeable difference in average Dutch fuel consumption between households near the border and those living in the rest of the country. Since average consumption in the Netherlands of households in the border region is lower than the average consumption in the rest of the Netherlands, we assume that some households living close to the border might have opted to refuel across the border.
Furthermore, from the chart above it is also possible to see that there is a clear spike in average fuel consumption across the entire country during the week before the excise duty increase. This indicates that households anticipated the upcoming price increase and filled up their tanks in advance, demonstrating their sensitivity to fuel price changes. There has also been a notable dip in average fuel consumption within the two weeks after the excise duty was implemented, likely because households started that week with fuller tanks.
After that period, it is possible to see that the fuel consumption did not return to pre-excise duty levels. After the tax increase, all households, regardless of the location, consume on average around two litters less fuel per week. Although this finding is correlational (we cannot infer causality from the results), it suggests that higher fuel prices tend to reduce fuel consumption.
Moreover, the chart illustrates that the difference in fuel consumption between households near and away from the German border exacerbated following the introduction of the excise duty. Households near the border, decreased their fuel consumption by an additional 3.6 litters per week (as showed by the interaction term between the border dummy and the tax dummy). The increase in relative fuel prices inducted by the policy led to a significant bigger reduction in fuel consumption for those living close to the German border, highlighting their (higher) sensitivity to price differences. For instance, assuming that the average consumption of Dutch fuel by border region clients is of around 20 litres per week, the tax increase led to a reduction in consumption of 15-20%. When Dutch fuel prices rise relative to those in Germany, individuals in the border regions tend to shift some of their fuel purchases to the cheaper neighbouring country.
Consequently, it's crucial for governments across the EU to implement similar fuel tax policies. This approach would discourage households near borders from taking advantage of lower fuel prices in neighbouring countries and would likely expedite the transition away from combustion engine cars by 2030.
Conclusion
To conclude, our findings indicate that Dutch fuel consumption patterns vary between households near the German border and those farther away. Although this disparity existed prior to the introduction of the excise tax, it intensified following the policy change. Households close to the border have been travelling to Germany to refuel, evading the higher fuel excise duties in the Netherlands. These results are in accordance with the results from the Dutch Ministry of Finance, even though the latter considers a different time period and a different policy movement (i.e. the excise duty reduction in 2022). Nevertheless, both studies find that tax changes result in border effects, emphasizing the importance of more equal rates within the European Union.
These behaviours counteract the fiscal policy’s objective of reducing fuel consumption, and, as a consequence, CO2 emissions. Given the European Union’s goal to cut emissions by 55% by 2030, these outcomes should be taken into consideration. To prevent consumers from shifting their fuel consumption to the countries with lower taxes, would likely require unified climate tax policies across the EU.
Appendix
Pin transactions are classified according to a Merchant Category Code (MCC) as per the type of goods or services provided ( for a detailed explanation of what MCCs are). Our research uses the transactions categorized under the codes 5541 (“Service Stations with or Without Ancillary Services”) and 5542 (“Fuel Dispenser, Automated”). Transactions identified with those codes are recognized as fuel-related expenses and aggregated on a weekly level.
Not all transactions at gas stations are related to fuel purchases. For example, people might visit gas stations to have a coffee or buy food. To ensure we focus only on fuel purchases, we exclude all transactions under €10. Additionally, to concentrate on household spending, we also exclude transactions above €200, as these are unlikely to be associated with filling a standard vehicle's gasoline tank.
To accurately capture households that use their car recurrently we add an additional filter of a minimum of fuel expenses of 150 euros over a three month rolling window. Additionally, to make sure households do not switch between the control and treatment group we remove households which appear to have moved houses in 2023.
*We use transaction data to gain better insight into economic flows. We only use aggregated and anonymized data for statistical research. The outcomes of the research cannot be traced back to an individual and are solely intended for economic research.


