SustainaWeekly - The disappearing corporate greenium

In this edition of the SustainaWeekly, we first investigate how the greenium for corporate EUR IG bonds has evolved over the last few months. Our indicators suggest that the greenium has virtually disappeared. We look into the reasons for that. In our second note, we present a range of climate indicators, which we use to assess the climate leaders and laggards within the group of the large emitters in the EU.
Strategist: We show that the corporate bond greenium has virtually disappeared, which could indicate a buying opportunity if investors think that corporate spreads are still due for further tightening. The greenium seems to be related with investor sentiment: the greenium increases when investors are in risk-off mode. A potential explanation for this could be due to green bonds’ lower volatility, which means that green bond spreads could still be due for a catch-up should spreads rally even further (we do not believe will be the case, though).
Economist: We focus on a number of relevant climate indicators in the EU. Of the top ten largest emitters in the EU, Italy performs best on all economic climate indicators, while the Czech Republic still has a lot of work to do. What further stands out is the relatively low share of renewable energy in the energy mix of the Netherlands and also Belgium. Even though energy efficiency is on the rise in almost all countries of the top ten largest emitters, some countries - such as Poland, Romania, the Czech Republic and Belgium - are lagging.
ESG in figures: In a regular section of our weekly, we present a chart book on some of the key indicators for ESG financing and the energy transition.
Where is the greenium for corporate bonds?
In this piece, we investigate how the greenium for corporate EUR IG bonds has evolved over the last months
We show that the greenium has virtually disappeared, which could indicate a buying opportunity if investors think that corporate spreads are still due for further tightening
We also show that the greenium seems to be related with investor sentiment: the greenium increases when investors are in risk-off mode
A potential explanation for this could be due to green bonds’ lower volatility, which means that green bond spreads could still be due for a catch-up should spreads rally even further (we do not believe will be the case, though)
The greenium becomes less evident – a buying opportunity?
We have written extensively about the lower credit spread ESG bonds ought to achieve versus their non-ESG equivalents, which should be primarily driven by a larger pool of eligible investors. Indeed, we have on various occasions shown that the broad secondary market for EUR denominated corporate ESG bonds is characterized by the presence of a greenium (that is, ESG bond spreads trading tighter than their non-ESG bond equivalent), with the majority of observations in our sample trading at negative values.
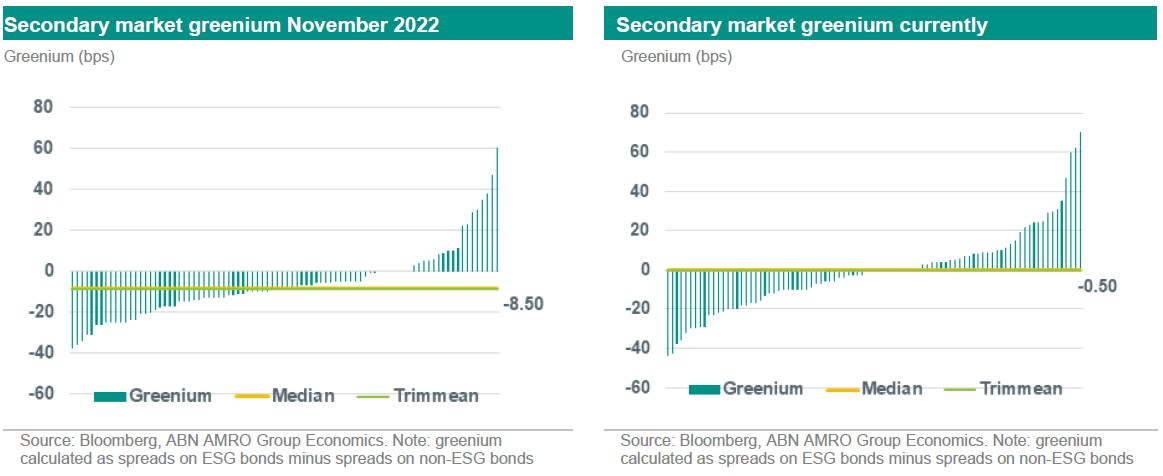
However, this pattern has recently changed. The charts below show how much richer or cheaper (in bp) each ESG bond is trading on a sample size of 90 corporate bonds in November last year and today. Admittedly, the universe of green bonds is much larger, but to calculate a greenium one needs to have a same issuer & same duration [1] non-ESG bond as a benchmark and this therefore limits the size of the sample. Whilst previously we saw roughly 5 to 6bp of greenium across the sample (expressed as average or median), the difference between ESG debt and non-ESG debt has now virtually evaporated. Secondly, we drew comfort from the overall left hand skew in the distribution, yet the sample currently does not exhibit an discernible skew (see chart on the right side).

The less discernible greenium today also seems to be market driven, as the outliers on the right, (a pick-up of 10bp or more being offered by the ESG bond), pertain to 9 issuers coming from a variety of sectors, including Schneider Electric (industrials), Volkswagen (automotive), Vonovia (real estate) and ENBW (utility). Actually the Schneider Electric green bond demonstrated a 25bp greenium in November, which has now strangely flipped into a 70bp pick-up, despite there not being any concerning news on the ESG front at this company, while actually emission intensity has continued to crawl downwards. We had earlier shown that from an impact perspective, Vonovia’s (including Deutsche Wohnen’s) green bond funded assets achieved one of the largest reductions in emissions across the residential real estate green bond space. This does not justify the green bonds trading at a pick-up the regular bonds. Investors are best off-switching from the regular into the green instruments for these issuers where the green bond trades at a pick-up. Should the broad spread market continue to perform, the gap to the non-ESG equivalent cannot stay wide as it will solicit a hunt for yield. In case the market for spread turn sour, which is what we actually expect, the ESG bonds should have already been subject to a large part of widening which implies that ESG bond investors should be able to outperform the broad market.
The lower greenium could be driven by green bonds’ lower volatility
While the analysis above looks at the entire ESG bond universe, we also focus exclusively on the green bonds to see whether the lack of greenium could have been caused by ESG non-green bonds in the sample. The graph below (left) shows in an index level, how the greenium has evolved over the last 2 years. Our sample takes into account green bonds included in the ICE BofAML Euro Senior Non-financial index (ticker: ENS0) that were issued before 1-1-2021 (this gives us an “apples-to-apples” type of comparison over the years). From the sample, we then try to find a non-ESG bond from the same issuer, but whose bond duration does not exceed the green bond’s by more than 1.5 years. This leaves us with a sample of around 60 pair of bonds.
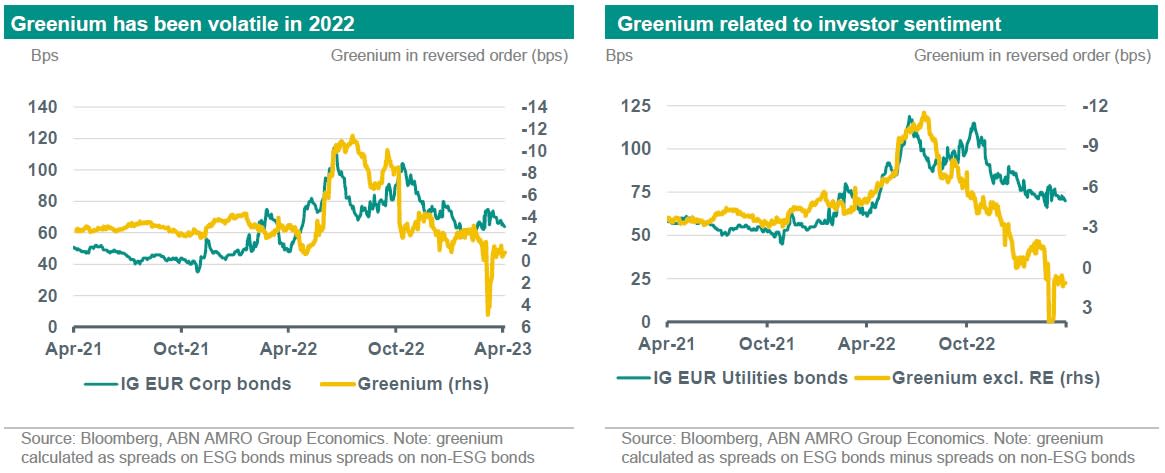
As shown in the chart below, the greeniums for corporates used to be relatively stable in 2021 at around -4bps, but it became increasingly volatile in 2022. One of the causes for the extreme volatility is real estate, where abnormal spread levels drove the green label of bonds to the backseat. We therefore exclude real estate bonds from our sample, to get a feeling on whether the greenium could have performed differently. This is shown on the chart below on the right hand side. However, even excluding real estate, we still see that the greenium has been very volatile in 2022. More than that, the greenium has been on a clear downward trend since the 3Q of last year.

We plot the greenium against corporate spreads from the from the ICE BofAML EUR IG corporates index and the ICE BofAML EUR IG utilities index (the latter for when excluding real estate green bonds – that is because once real estate is excluded from our sample, the vast majority of the pairs in our sample refer to utility bonds). The charts above allow us to see that there seems to be a relationship between investors risk sentiment and the greenium (in particular, when excluding real estate, due to the previously mentioned “abnormal” behaviour in 2022). That is, once investors become more risk averse (credit spreads widen), the greenium tends to increase, and vice-versa.
There are several potential explanations for this. One of them could be related to the fact that green bond spreads move less than their non-green counterparty. And indeed, as we have previously shown on an index level (see ), green bonds seem to show significantly lower volatility levels than non-green bonds. This is due to, for example, the “buy and hold” approach (and more long-term view) of most dedicated ESG investors. Hence, if markets have rallied, it could be that green bond spreads are still due for a catch-up. However, as we previously noted, as we expect still a bumpy ride for EUR IG bond spreads ahead of us, green bonds could provide investors with a “nice place to hide”, given that these bonds have already been subject to a large part of the spread widening.
Another potential explanation for the relationship we see between greenium and investor sentiment is that green bonds are perceived as a more “safe haven” by investors. Also as indicated by their lower volatility, investors tend to prioritize the selling of non-green bonds when in risk-off mode. As we currently stand in a more “risk-on” environment (as also shown by credit spreads rallying), it could be that investors are also now reversing their green bond positions. We believe the first explanation could be more plausible, though.
[1] When actual reference bond could not be found, we took the interpolated spread on that duration from the issuers non-ESG bond curve.

