Stacking climate risks and financial resilience in the housing market

Climate change creates greater risks that are more frequent and cause more damage to Dutch homes. This study addresses the question of which districts can be deemed ‘climate-vulnerable districts’, i.e. those in which the risks of climate change, but also the costs of energy efficiency measures, may be too much for homeowners or properties to bear.
First published 28 November 2023, co-author Bram Vendel
Climate-vulnerable districts mapped.
Risks of flooding and foundation problems are still barely reflected in discounts on home prices. As a result, future buyers bear these risks on their own, and there is the danger of undervaluation of homes among current homeowners. Though energy efficiency costs are fully priced in, this does not yet mean that homeowners will be able to pay for energy efficiency measures after purchase.
The good news is that not all risks exist everywhere at once; in fact all the risks are never present at the same time in a particular situation. The bad news is that in financially vulnerable districts, even one of the risks may be too much for the homeowner to bear. This study pinpoints, for the first time, these climate-vulnerable districts.
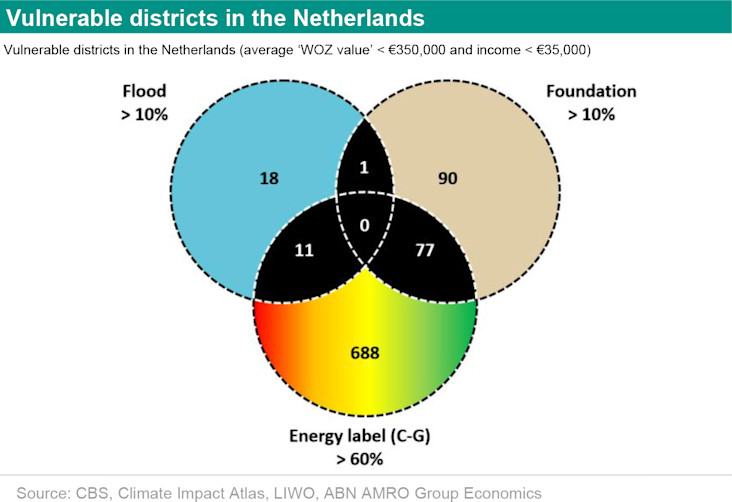
In 900 districts, the climate risks and especially the sustainability challenge may be too much for at least 10 percent of its residents. In 90 of these districts, we see a combination of two risks at play in vulnerable households. This is where the highest priority should lie, starting with the districts where more than 70% of the properties are privately owned. Combined funding through the recovery fund and the heating fund could possibly provide a solution in these districts.
Pricing climate risks is ultimately a risk allocation issue between present and future owners. As future owners face increasing risks, having current risks priced in as soon as possible is desirable. This can be done by making information about these risks a mandatory part of the negotiations between buyer and seller. The price discount allows prospective buyers to finance the recovery measures while avoiding unnecessary risk premia in the market concerning locations where no risks are involved.
There may be a role for mortgage lenders and the government in preventing vulnerable households from flocking to properties that have fallen in value due to risk pricing.
Besides these direct effects on the value of properties and financing recovery measures, indirect effects on both the local and national economy can also be examined, which we are doing together with economists from Rabobank and ING in a follow-up study.
Climate-vulnerable districts: where risks stack up
It cannot have escaped anyone’s attention that extreme weather conditions are already occurring on a more frequent basis these days. In the Netherlands it is more often warmer, drier, or even wetter . This leads to loss and damage. During heavy rainfall, basements and ground floors are flooded, and flooded roads and infrastructure also cause loss and damage and can even bring economic activity to a standstill. In extreme and prolonged droughts, groundwater drops, causing wooden pilings to rot and foundations to subside. Cracks appear in a house and, in the worst case, the home is declared uninhabitable. In the Netherlands, drought also increases the risk of wildfires and, with this, the risk of damage to properties near forests.
If no additional climate adaptation measures are taken, such climate-change-related problems will occur more often, be more extreme, and happen in more locations in the Netherlands. KNMI recently released new estimates of the changing climate in the Netherlands between now and 2050 and 2100. The indication is that the Netherlands will become drier and experience more heat waves, sea levels will rise, and heavy rainfall will increase substantially* . According to KNMI, depending on how much CO2 is emitted worldwide, for one the lack of precipitation during the summer could potentially increase by some 13 to 35%.
(*There is debate among experts about whether flood risks are increasing, remaining the same or even decreasing. KNMI states that the flood risks for regional defences and from heavy rainfall are increasing, while those for primary defences are not. There is debate on how many adaptation measures you can assume will be needed for the future. If there were to be infinite funding and technology available for adaptation, risks would never increase but decrease. We use the most recent risk maps from KNMI. These have not yet been updated to reflect the 2023 scenarios, which show an increase in weather extremes compared to previous scenarios.)
To counter the effects of physical climate change, dykes are being substantially strengthened until 2050. This will reduce risks in areas protected by primary flood defences. However, the risk of damage from extreme rainfall and flooding in areas outside the dykes will increase. The foundation risk, on the other hand, can be partly reduced by raising groundwater levels, but there are no concrete plans for this yet.
Besides the physical impacts of climate change, there is also the sustainability challenge. The question we focus on in this publication is: where in the Netherlands is the probability that homeowners will no longer be able to bear the costs of remaining resilient to both climate change and the sustainability challenge increasing? To this end, we analyse risk maps showing flood risks (primary and regional breaches), foundation risks (pile rot and differential subsidence) and sustainability risks, and the extent to which these problems play out in districts where properties and homeowners are vulnerable. By risks around climate change and sustainability, we mean the currently known probability of damage and costs between now and 2050. These costs arising from damage/loss and/or energy efficiency measures will either fall on current or future owners, depending on the extent to which those risks are already priced into residential property value today.
We analyse the risks for homeowners in terms of property value change and the ability of homeowners to repair damage and make the home energy efficient. As there is still too little reliable information available at the level of individual households and properties, we have limited our study to a district-level analysis. Based on this, we hope to provide tools for policymakers, financial institutions and other stakeholders to start working on tailor-made solutions for the most urgent districts, solutions in which the problems facing a household can be addressed as collectively as possible.
Situations vary, and risks are often overestimated
The KNMI warning may sound alarming, but it should be kept in mind that not all risks are everywhere at once. The risk of damage and its severity vary by property and location. The government’s climate risk maps make it clear that the risks of drought and foundation problems, for example, do not usually play out in locations with a real risk of flooding. When interpreting the risks of damage, the alarm is increasingly being sounded too loudly. For instance, Calcasa hit the news last week with on a potential home value loss of €179 billion due to flood risk. However, this was based on a tally of all homes with some flood risk and then, based on this, calculating the loss in value per flood probability if that flood were to occur. Furthermore, the figure includes decreases in value for a flood that occurs only once every 3,000 years. Aside from this, the level of the water and the duration of the flooding strongly determine the potential damage, as well as depreciation, while these aspects were not included in the study. In the Calcasa study, the assumed decrease in property value on locations with ‘high probability of flooding’ is almost ten times higher than what we see in practice for houses with this similar probability of flooding in the It is very important that research institutions accurately and factually identify and communicate the risks. A flood will only affect a small part of the Netherlands, and probabilities for of all events cannot just be added up. By omitting this information, risks may be overestimated and this could lead to incorrect conclusions.
Housing value decline due to climate risk
When homes are damaged, they lose market value. When homeowners repair the damage and buyers trust that the damage will not recur, the value will basically return to its previous level. Risk can be divided into two types: current risks and future risks. Current risks are risks for homeowners that occur even without climate change. Indeed, foundation risk also exists without climate change and floods also occur once every few years. Future risks, on the other hand, are determined by climate change and possible adaptation measures. For instance, foundation damage is expected to develop faster due to periods of extreme drought, and flooding due to heavy precipitation is expected to increase, while adaptation measures will reduce the risk of flooding at primary and regional flood defences.
As the risk of future climate damage is higher in some locations, this will affect the valuation of properties in these locations. In theory, the depreciation is equal to the future discounted cost that residents have to incur to repair the damage, multiplied by the changed probability of the damage occurring. For example, if the probability of foundation problems increases from 0% to 50% over ten years and the cost of repair is €75,000, a property worth €350,000 now is expected to be only worth €312,500 in ten years’ time, assuming the overall price level remains stable. After the foundation has been repaired and is expected to remain in good condition for a very long time, the value of the property will return to the original €350,000.
When risks are not priced in
Climate risk pricing is about sharing the cost of repair between a current and future owner, i.e. between the seller and the buyer. When a property with bad foundations or a high flood risk is sold without the buyer being aware of this, the full cost of repairs falls to the buyer. When both parties know that there are problems with a property’s foundations or that it has a higher flood risk, the seller covers part of the damage by way of a lower selling price.
In practice, it is generally unknown whether the foundations are good or bad. And currently, flood risks seldom lead to price discounting in the Netherlands. The visuals below depict for foundation risks (top) and flood risks (bottom) the difference between these climate risks being priced in or not. Without risk pricing (shown by the W line), a buyer approaches a house ‘blindfolded’, so to speak, and pays the full price (as if there were no risk). After the purchase, the risk of damage may reveal itself through inspections, government policies or, in some cases, because the damage actually occurs. In all these cases, the value of the property suddenly drops to the W* line. This is the actual value, including the discount for the damage/probability of damage.
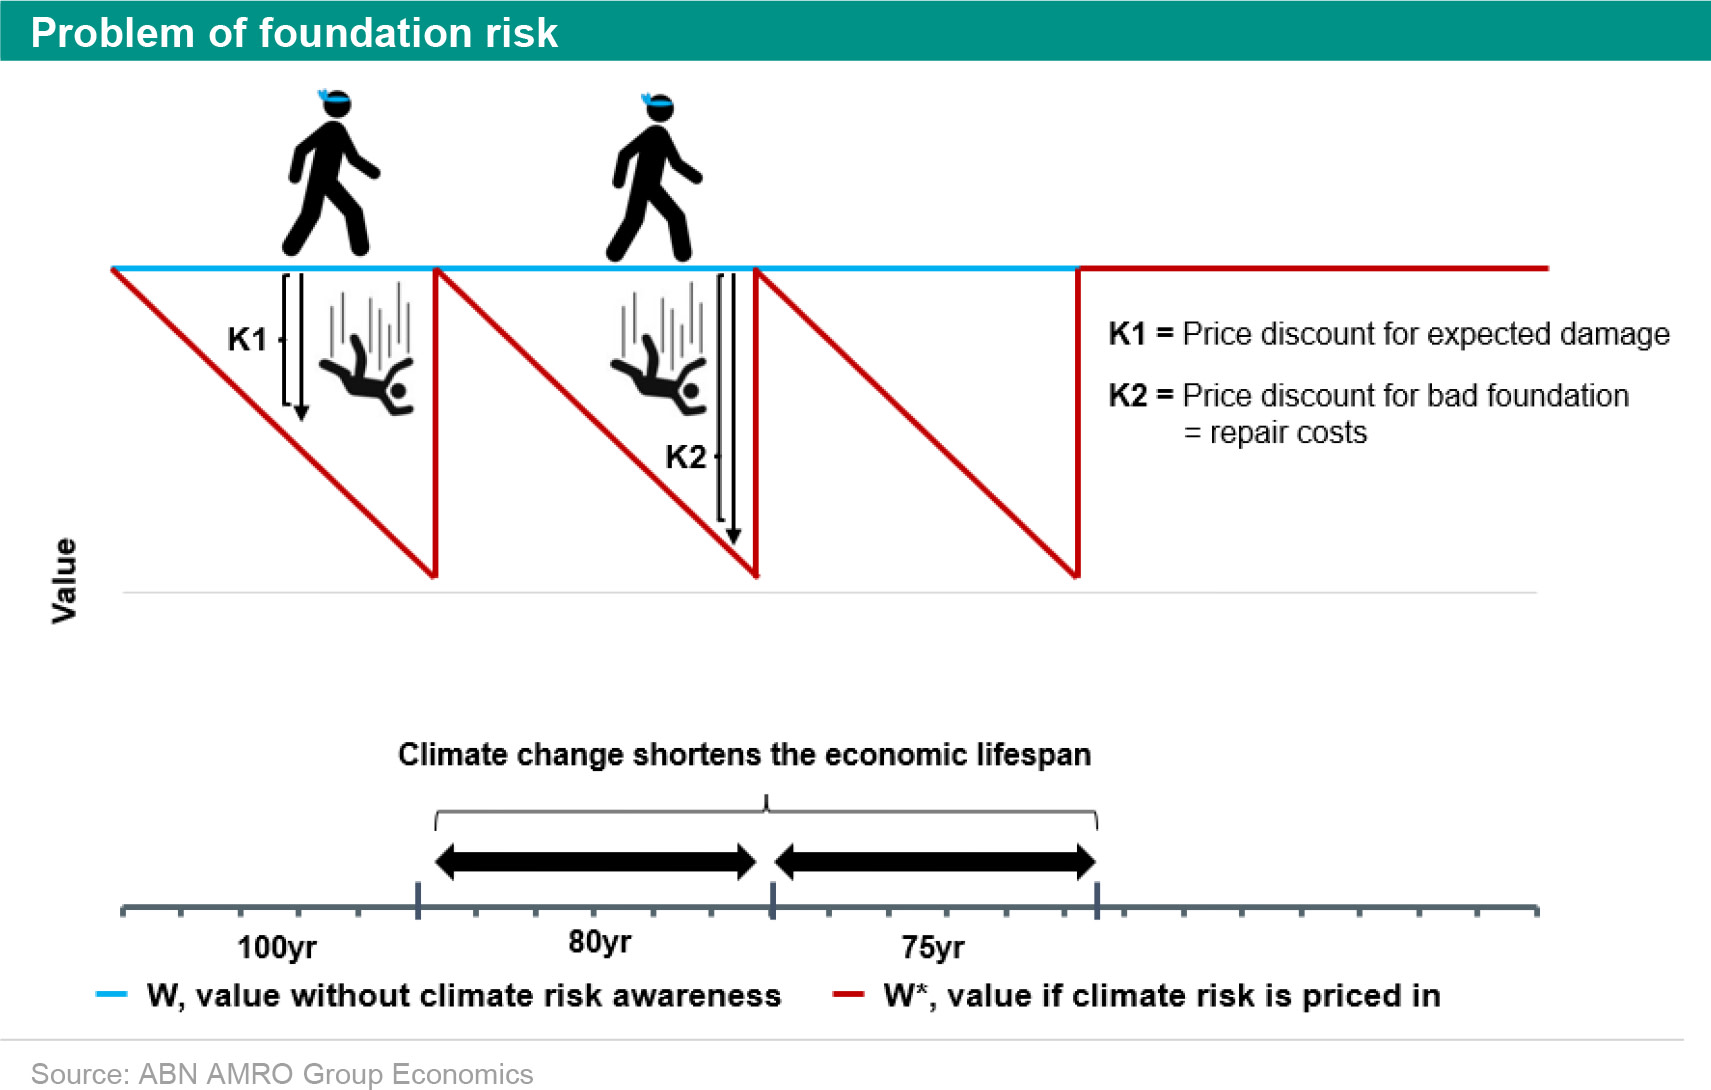
The path of the value W* (including risk) is different for the foundation risk than for the flood risk. Because foundations have to be replaced over time, the risk of replacement increases with time and thus the value W* decreases. Without climate change, wooden piles can be expected to last about 90 years. Climate change causes lower and more changeable groundwater levels and weaker soil, which reduces the lifespan of piling, as well as other types of foundations, which then requires earlier replacement.
For the flood risk, the value W* (including climate risk) runs differently. A flood leads to sudden damage during and immediately after a flood, causing the value to drop. But because hardly any homes are sold at that time and selling and buying only resume once properties are repaired, value recovery occurs relatively quickly. that for the first four to nine years after a flood, buyers demand a price discount (which gradually decreases) for the risk of flooding. As floods (caused by heavy rainfall) become more frequent and severe, our expectation is that the very limited price discount for flood risk that existed in the past will increase in the future and people will be less likely to overlook flood risk in their home transaction.
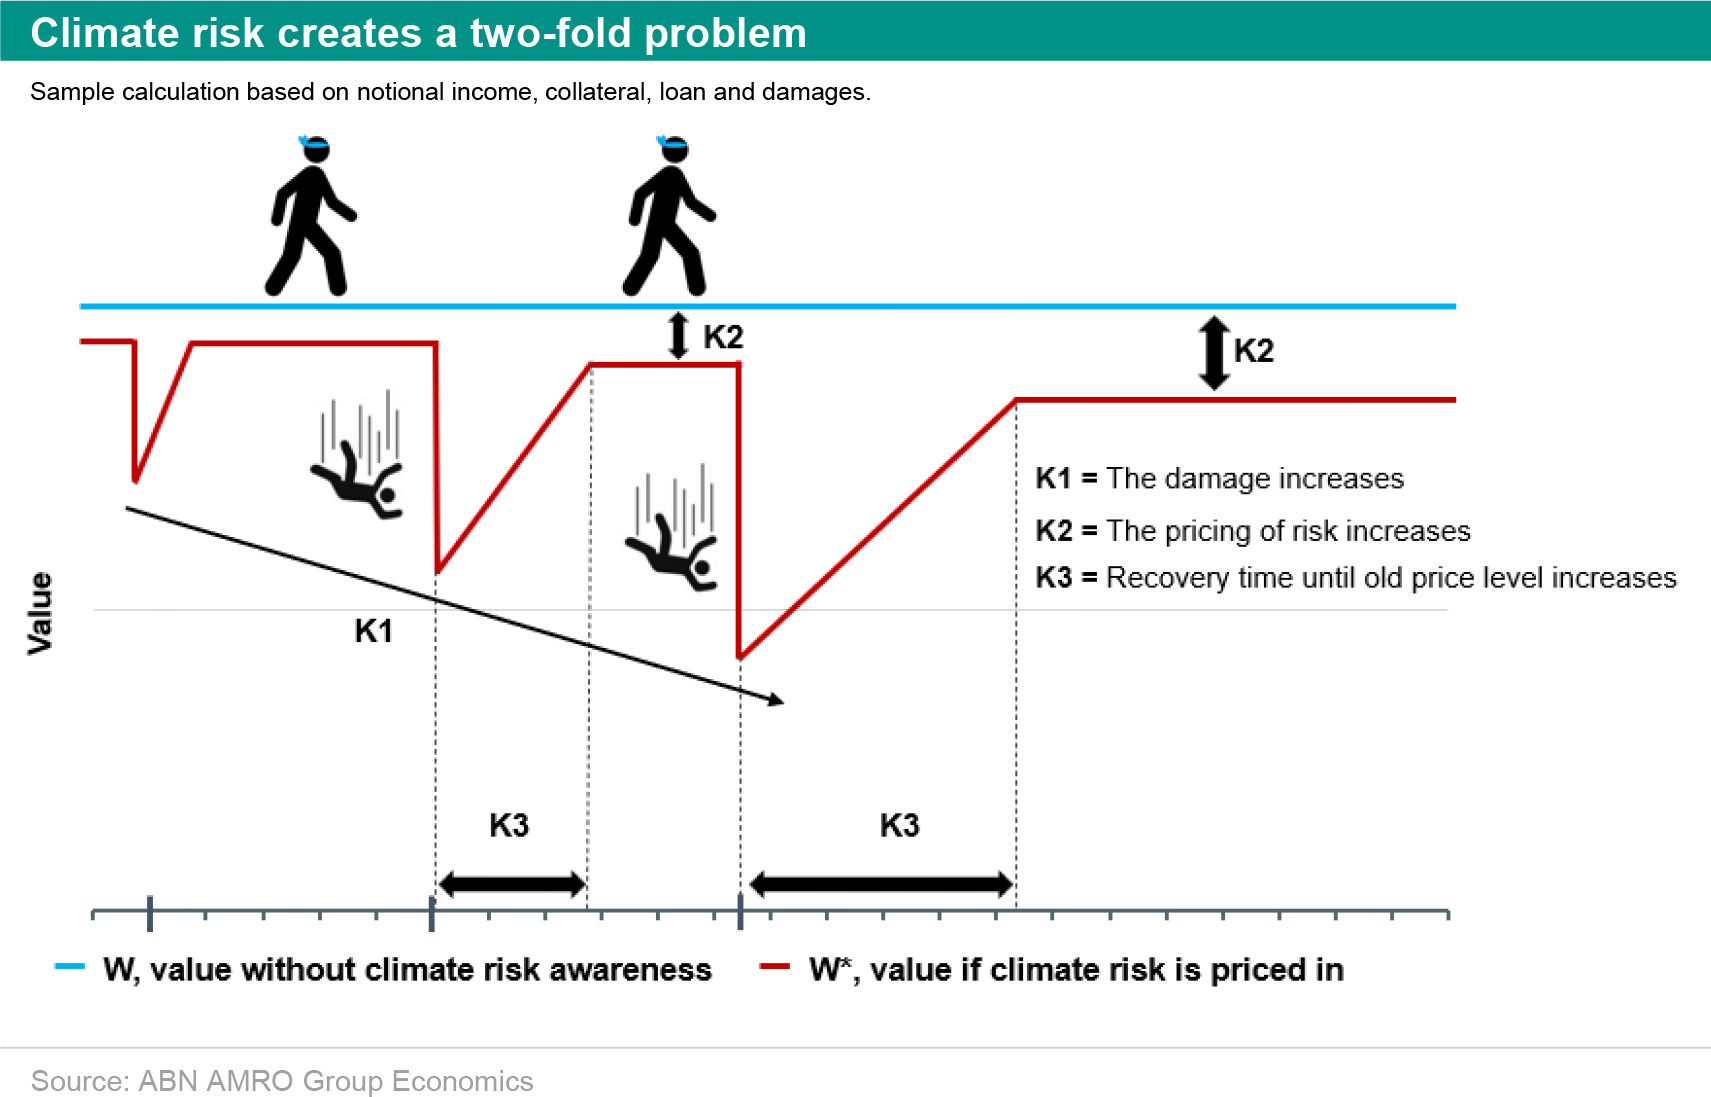
For a buyer of a property with either a flood risk or foundation risk, the risk-increase W* and the associated price discount (K1) fund the buyer’s part of the future repair costs. For the foundation risk, if a buyer purchases a property with a bad foundation that needs immediate repair, the price discount (K2) the and therefore also covers the full cost of repair.
For properties that do not change hands, the decline in the value of the property due to climate risk is basically the same as for properties that change hands. With a mortgage loan equivalent to the value of the property, owners then soon find themselves ‘underwater’, that’s to say the loan exceeds the value of the home and the home now has negative equity. This situation can keep a homeowner from moving up the property ladder. Currently, for most homeowners the value of their home is considerably higher than the mortgage, limiting this risk.
Calculation example: impact on mortgage and borrowing capacity
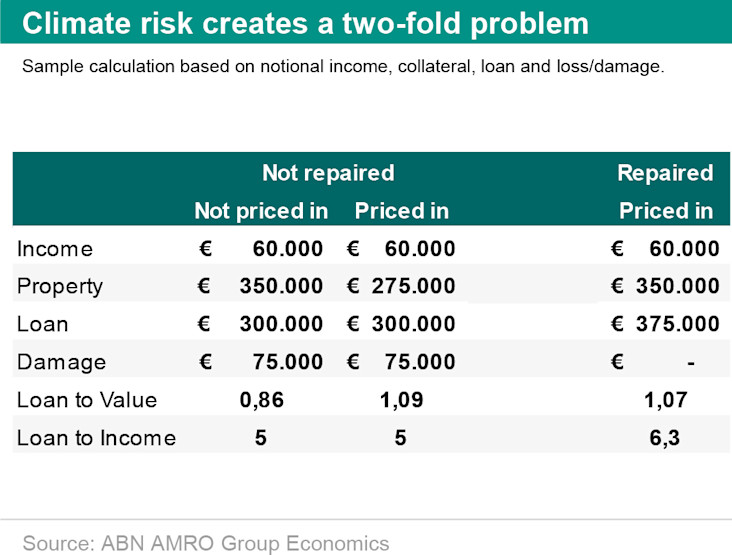
The table below shows the consequences when climate risk is not priced in. If the damage were to be fully priced in, the €350,000 house would drop €75,000 in value and the new value would be €275,000. As a result, the original loan becomes a lot higher than the value of the collateral, meaning the house now has negative equity. Repairing the damage could be paid for by increasing the mortgage. However, in addition to the negative equity problem, an ‘income problem’ may also arise. Due to insufficient income, the homeowner will be unable to raise the mortgage to finance the repairs, given that the monthly mortgage payments would then be too high. This could mean that the homeowner will be forced to sell the house.
Climate maps available but seldom used
Since 2017, the Dutch government has made available maps showing climate change and its expected future damage by location on www.klimaatschadeschatter.nl. In theory, these maps could be used to estimate the risk of a house before buying it. This means that an estimate of the future cost of foundation repair can be made and this information factored into the price. In practice, however, this proves difficult and is seldom done. on the impact of climate risks on the Dutch housing market, the Dutch Authority for the Financial Markets (AFM) recently warned that, due to information asymmetry, climate risks are insufficiently factored into housing transactions, with the result that buyers bear the risk of depreciation.
Climate risk maps are not easy enough to find and even harder to interpret. Like the AFM, we suspect, based on our own research using these risk maps, that the risks of future damage due to climate change seldom lead to price discounts on a home purchase. Due to information and knowledge asymmetry, homeowners and home buyers do not know what information is available or how to interpret it. And even if they do, people in a tight housing market do not act on this information. Sellers are in control, making it almost impossible for buyers to negotiate a discount based on an informed risk assessment. Having a foundation survey carried out is often not feasible, and even if this is done and a prospective buyer makes a lower offer based on the results, they run a high risk of the house going to someone else.
Buyers not negotiating lower prices for properties facing climate damage in the future is not a given. For example, in the US we see that properties that will be flooded in 2100 due to expected rising sea levels are already worththan comparable properties that do not face this future risk (Bernstein, et al., 2019). Unlike the Netherlands, in the US it is possible for homeowners to take out personal flood insurance. Here, a higher risk leads to a higher insurance premium. The costs of insurance is factored in by home buyers and as such, property prices are lower.
Clear current risks though price discount
In the few cases where climate risks are clearly communicated or clearly visible, we see that this has an immediate effect. Our own research shows that mentioning a poor foundation in the property’s listing leads to a drop in the sale price of as much as 12% compared to a similar house with a sound, repaired foundation. et al (2023) at the Delft University of Technology on the 1993 and 1995 floods in the Province of Limburg shows that houses flooded or located in a flood zone have a price discount of 5 to 10%, but that this disappears after a period of time. Both examples of priced-in climate risks arise because the damage has already clearly manifested itself.
Energy efficiency costs priced in, but not affordable everywhere
As for sustainability, the cost of making a home energy efficient is already factored into the price. The energy efficiency of a home can be seen through its energy label and monthly energy bills. even before the energy crisis that the cost of implementing energy efficiency measures was increasingly resulting in homes without these measures having price discounts. Last year’s high energy prices accelerated this trend. Compared to an A-label home, buyers of a C-label home pay on average 5.4% less. This price discount reflects the difference in the monthly energy costs as well as the indirect costs of the long wait for implementing energy efficiency measures due to lack of labour and materials.
The regulations for making a home more energy efficient when selling or renting it are becoming stricter. The accelerated pace and the associated possible rush may increase the scarcity of materials, labour and implementation capacity, and hence costs. Increased costs and longer waiting times may make it harder for homeowners to invest in making their home more energy efficient.
Ability to absorb damage/costs per district*
The ability of a homeowner to absorb the accumulation of climate damage and energy efficiency measures depends on the costs, the value of the home compared to the cost of repairing the damage/implementing the measures, and the financial capacity of the owner to repair damage/implement energy efficiency measures. This combination of factors makes some areas especially vulnerable to climate risk. Take these two situations for example. A house along Amsterdam’s ring of canals is worth a lot, is most likely occupied by someone with a high income, and the sum involved in repairing damage is likely relatively low compared to the value of the property. On the other hand, homeowners of homes with a low value relative to the cost of repairing damage are vulnerable. The investment required for climate damage may not be cost effective. can easily climb to between €50,000 and €100,000, a price tag that is not reasonable for a property with a poor energy label and low value. One could argue that, in this case, this house is not worth repairing. For these homes, demolition and building a new home would be a possible solution that is a better fit and sufficiently cost effective.
(*Tenants can also be vulnerable in case of damage or if the landlord lacks financial resources or does not see the need to repair damage. In the first instance, the tenant bears the risk for the home contents and the landlord for the building and structures. However, this year, a judge ruled in favour of a tenant in Amsterdam, saying that the landlord had to repair the foundation. This ruling highlights the importance of the legal protection of tenants and their less vulnerable position compared to homeowners, even in the case of foundation problems.)
The solution chosen will depend partly on the financial position of the homeowner. An owner with sufficient savings and room for a mortgage increase will have more security than a homeowner who does not have these resources. Homeowners with insufficient savings and/or borrowing capacity may be able to use the heating fund for energy efficiency measures, or the sustainable foundation repair fund for repairing foundation damage. Financially vulnerable homeowners will not be ‘dispossessed’ by unforeseen costs, but they will end up with higher debt if they want to repair the damage and they were already up to their maximum borrowing capacity before the damage occurred. Funds are willing to provide financing to vulnerable owners if their own financial resources are insufficient or raising the mortgage is not possible.
Climate and sustainability risks by district
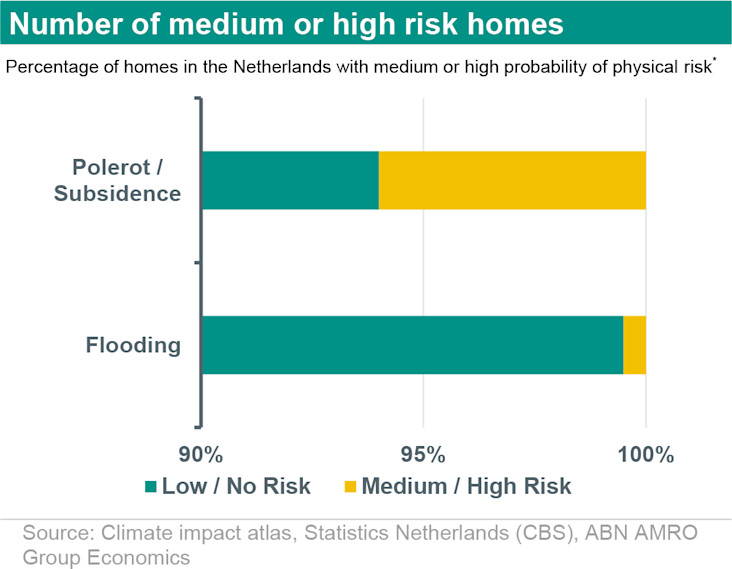
At the national level, based on the risk maps of Climate Impact Atlas and the National Water and Flood Information System (‘LIWE’), relatively few homes have a high to very high probability of physical climate risk*. The proportion of homes with medium or high risk ranges from about 0.5% for flooding to nearly 6% for pile rot and differential subsidence. The probability of a 50cm flood from water breaking through a flood defence is almost ten times lower than the probability of pile rot or differential subsidence. However, properties with a high risk of flooding, pile rot or differential subsidence could possibly suffer serious damage.
(* Medium or high risk refers to the Climate Impact Atlas classification for pile rot, differential subsidence and the site-specific flood probability (>1/300)* The 2050 probabilities have been included for both risks, and specifically for flood risk, the probabilities of flooding of 50cm or higher have been included)
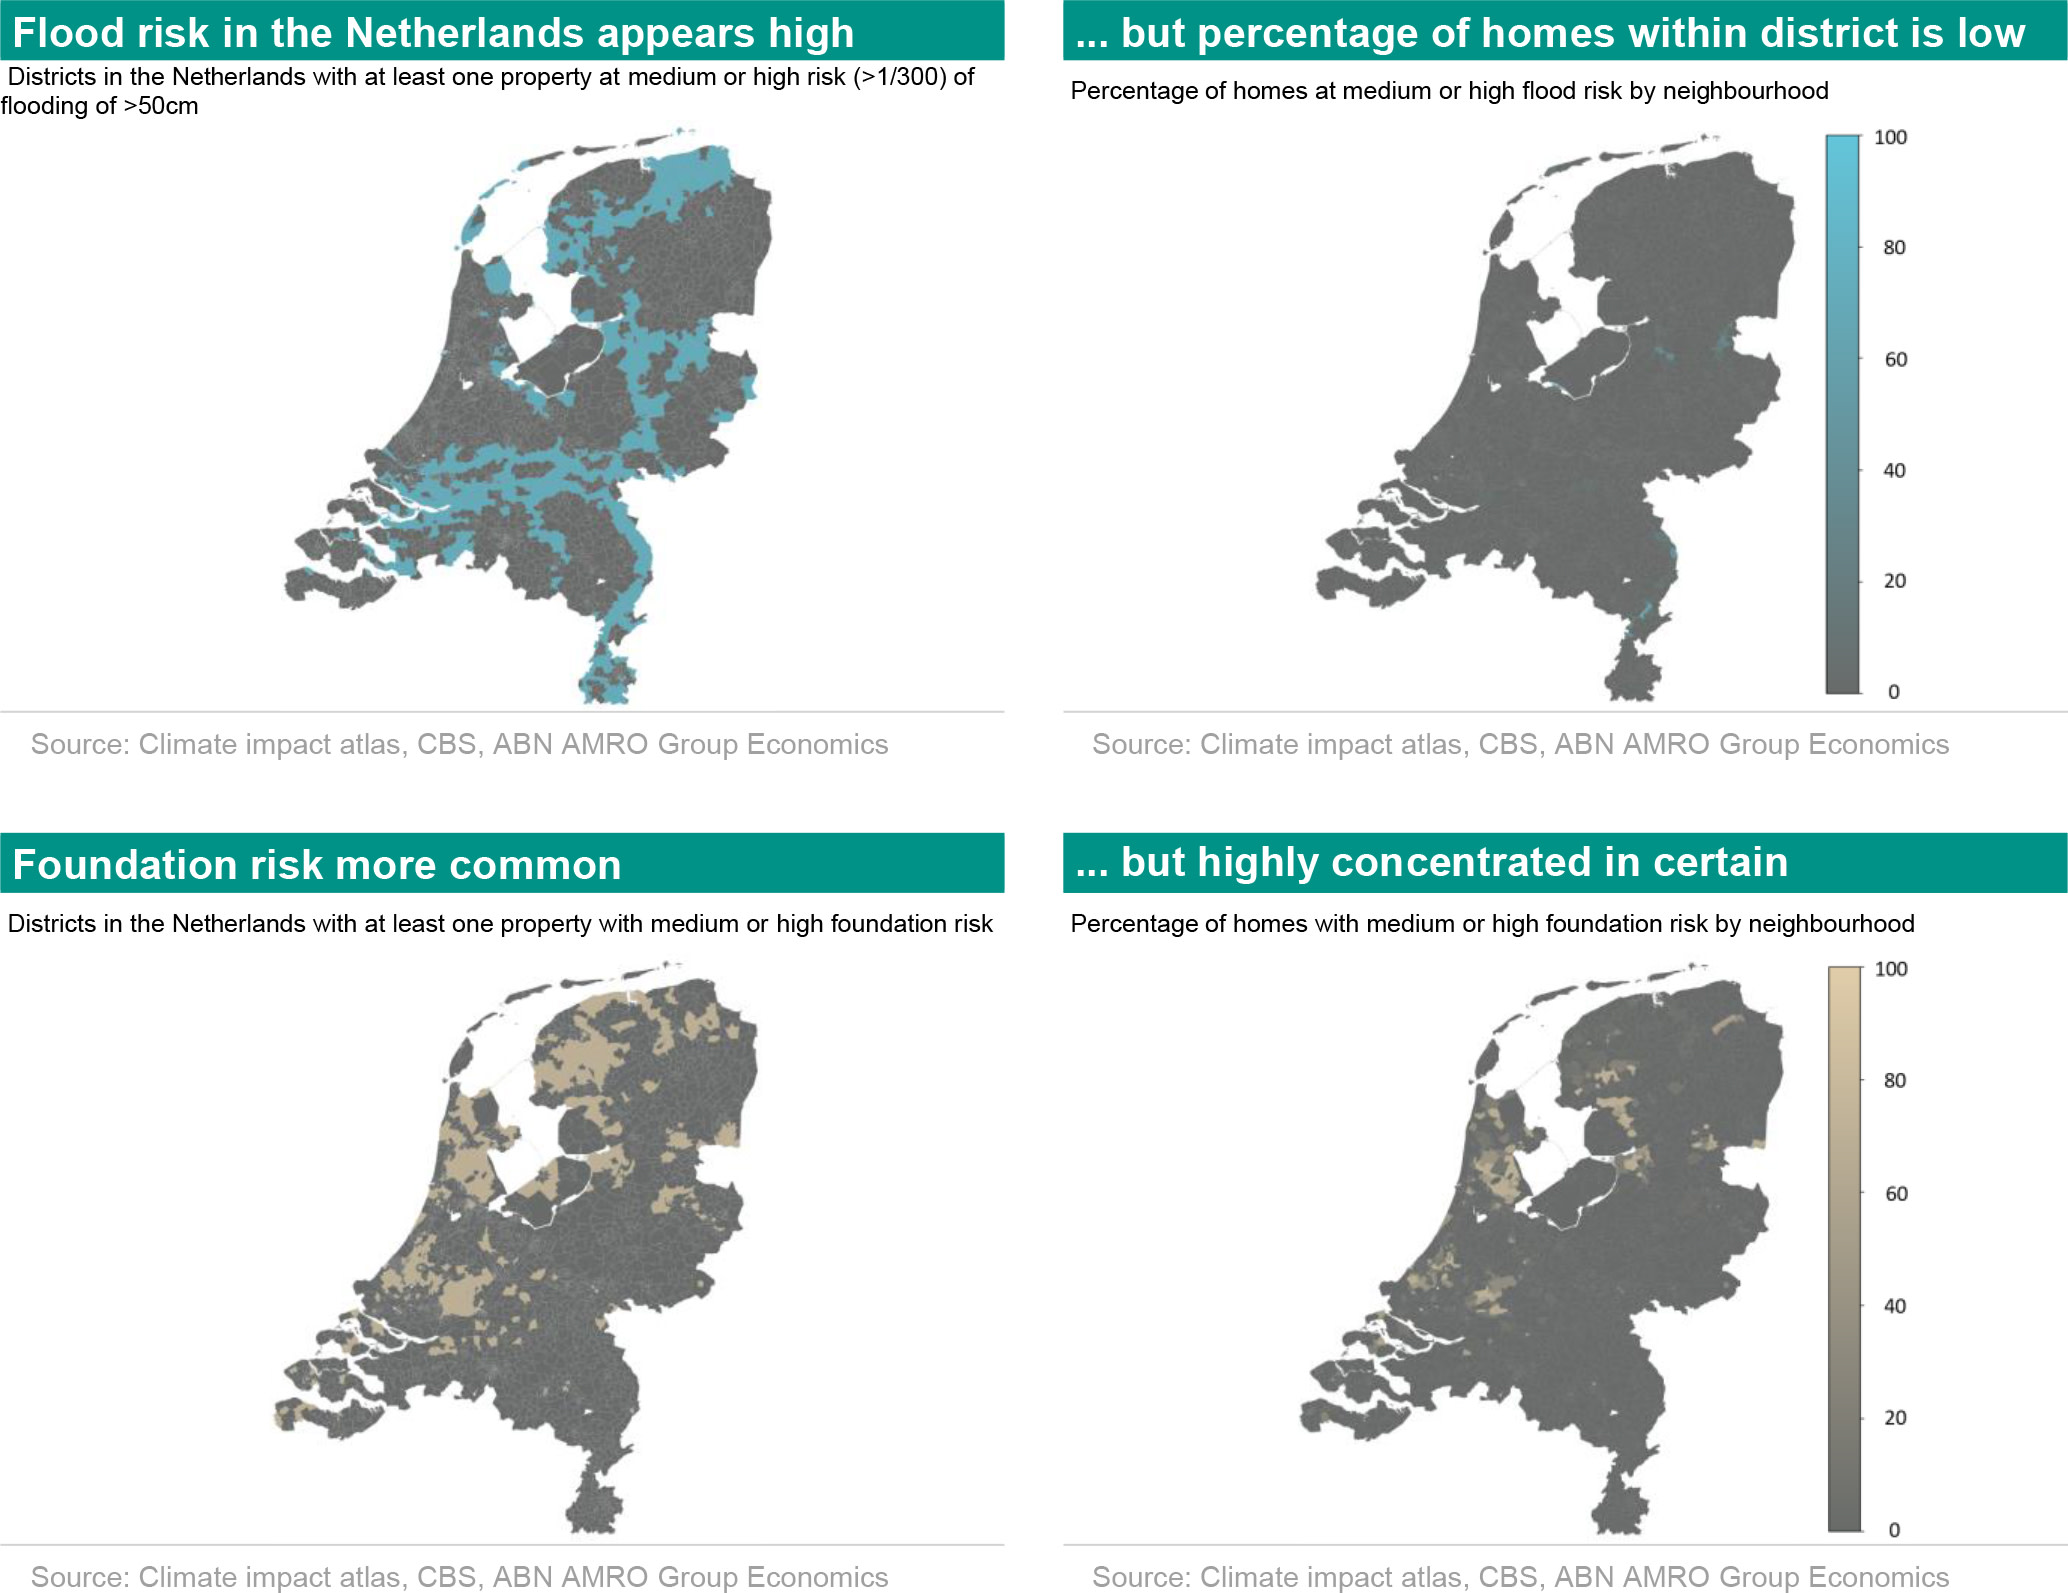
The probability of a certain type of risk is mainly related to where the property is built, at what elevation it is located and on what surface it stands. For example, districts with medium or high risk of flooding are often characterised by being at a low elevation along rivers and having a high probability of flooding. This is more common on the eastern side of the country. In contrast, houses with pile rot or differential subsidence problems are often located in urban districts, or in rural areas with peat or clay soils that dry out easily.
These are found more in the north and west of the country. For only a small number of areas, these risks overlap. Homes in most parts of the Netherlands have no medium or high risk.
Within districts, the percentage of homes affected by physical risk also varies widely. A large number of districts in the Netherlands have at least one property exposed to medium or high physical risk. However, when looking at the percentage of homes within these districts, it can be seen that this often affects only a small part of the district. A small proportion of homes in the Netherlands have a medium or high climate risk, and at the district level, it can be seen where these are concentrated.
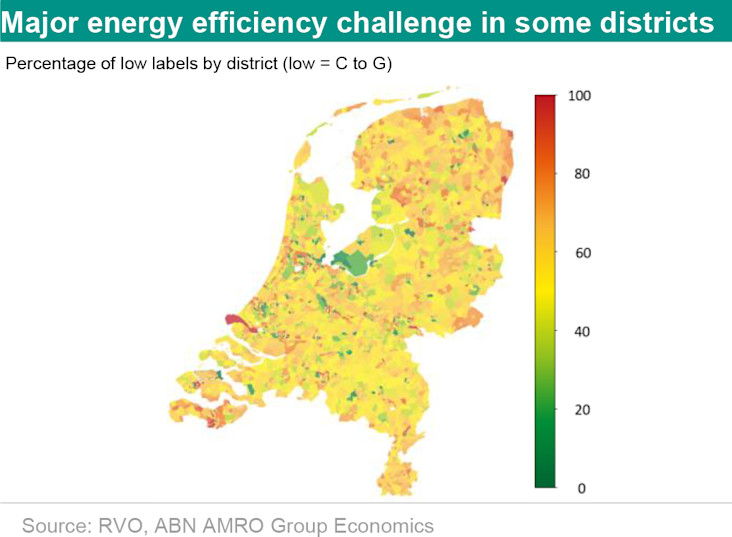
The sustainability risks per district are defined as the percentage of houses – rental and owner-occupied – per district with an energy label C to G. In other words, to what extent is a lot of investment still needed to make a district energy efficient?
The reliability of the current state of energy labels in the Dutch housing market could potentially give rise to an unrealistic picture. This is because the dataset contains only valid registered labels. Some currently has a valid registered energy label. shows that by 2022 alone, four in ten mortgage owners will have made the home more energy efficient. Many of these renovations are not known because a label registration is only mandatory when the home is sold or rented out. It is plausible that existing estimates on provisional labels significantly underestimate the energy efficiency of the housing stock in the Netherlands, making it appear that households are more vulnerable than they actually are*. For this study, we nevertheless use this current estimate of energy labels, because it was the higher and upper-middle-income households that used their extra savings after the Covid period to make their homes more energy efficient. The low and middle-income owner-occupiers targeted by this study these extra resources, making it more likely that their energy label estimate is realistic.
(*We are researching the current state of energy labels in the Dutch housing stock and will update our analysis as soon as we have this data.)
Because the cost of implementing energy efficiency measures is largely priced in, the value of a property at purchase already contains a price discount that takes into account the costs of these measures. However, this does not alter the fact that a potential buyer may not have the income or assets to make the property more energy efficient after purchase. This would require them having and using their own savings or arranging an increase in their mortgage. The change to , which will ensure that homeowners can borrow up to a maximum of €20,000 for energy efficiency measures regardless of income, may help in this regard. That said, this does not change the fact that homeowners will face higher mortgage costs, which they may find difficult to pay.
Methodology and data: linking data and stacking risk maps
The Key Register of Addresses and Buildings (Dutch initialism: ‘BAG’) forms the basis of our analysis. The BAG dataset contains data on all addresses and buildings in the Netherlands. In this dataset, it is known at property level whether it is used as a dwelling. By filtering the data for the designation ‘dwelling’, all dwellings in the Netherlands can be selected. Furthermore, data from Statistics Netherlands (CBS) were used to link district and district data to all dwellings in the Netherlands. By linking at dwelling level, district and neighbourhood statistics can provide important information about the district’s risk.
The main data for this study came from the Climate Impact Atlas and the National Water and Flood Information System (‘LIWO’). The Climate Impact Atlas is an open platform that makes climate data available to professionals directly or indirectly involved in climate adaptation. LIWO is also an open platform that makes map layers available, albeit specifically for floods. The climate risk maps for flood and foundation risk are geographically linked based on the coordinates of each property. This makes it possible to determine for each property whether there are climate risks involved.
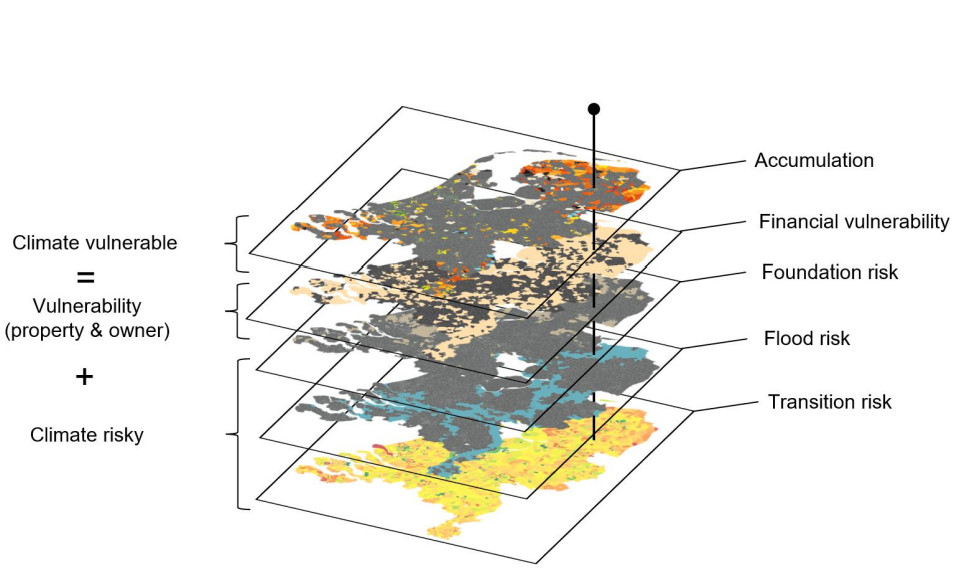
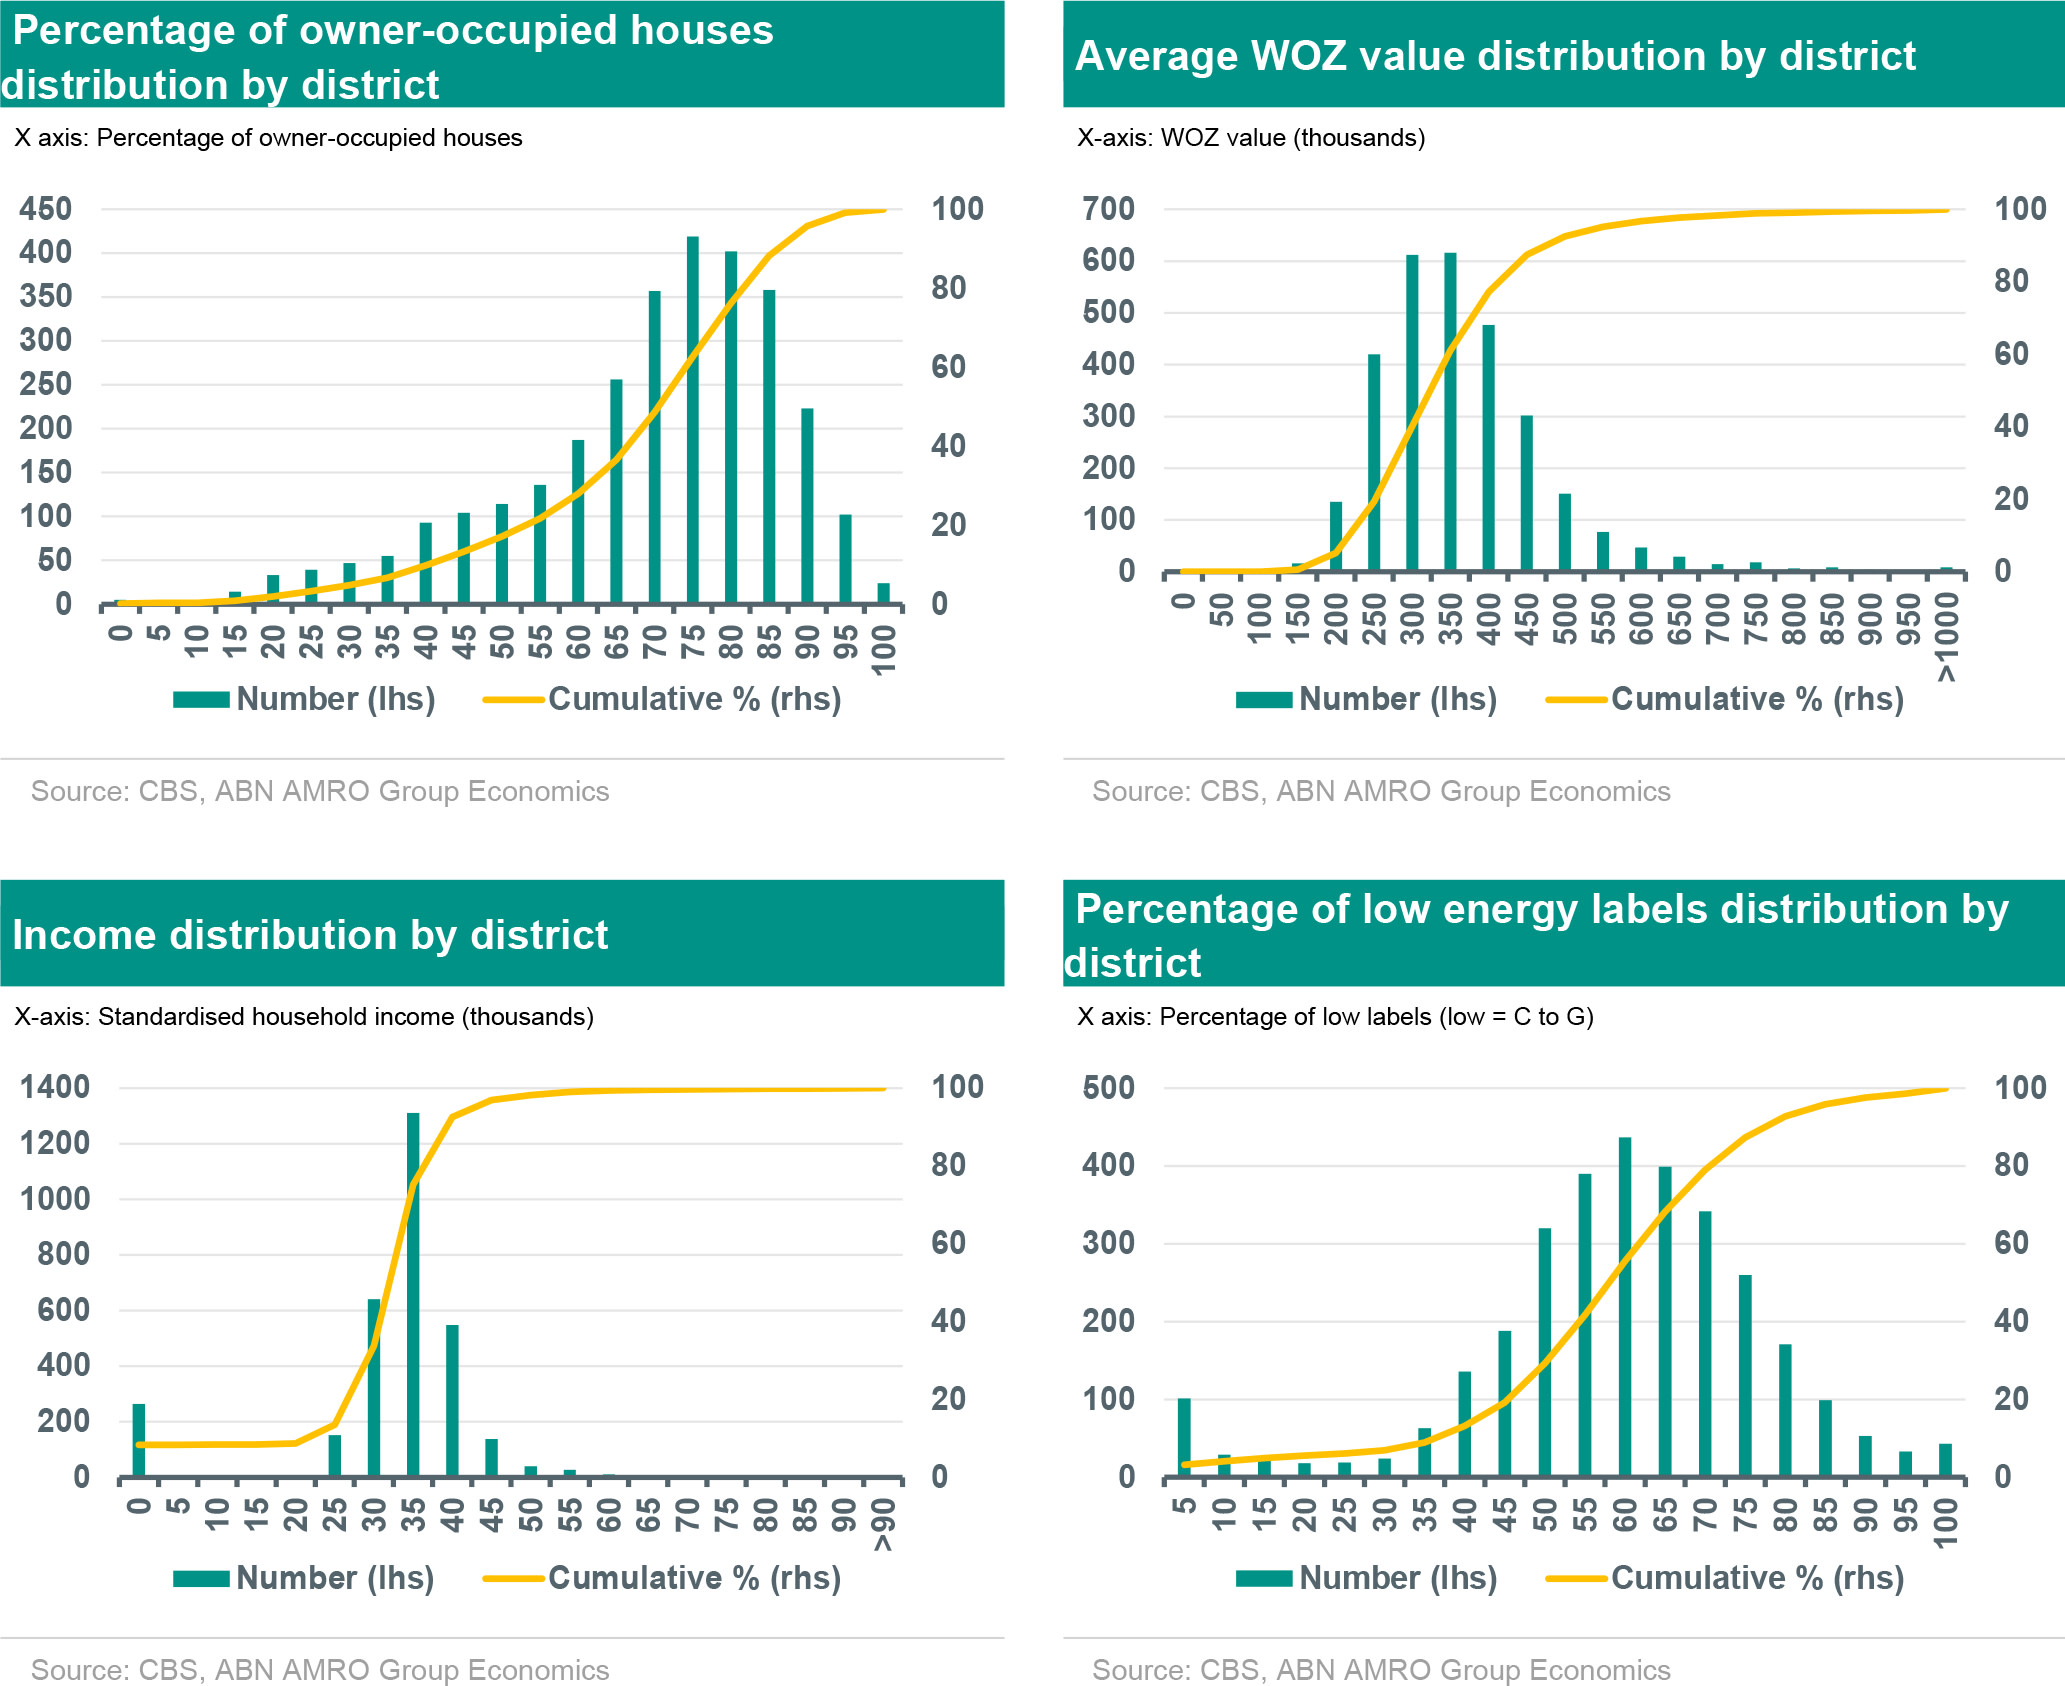
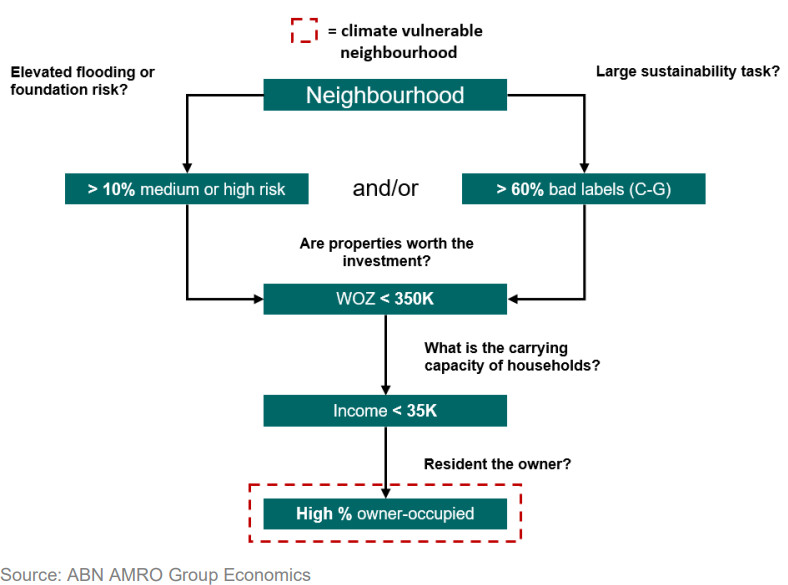
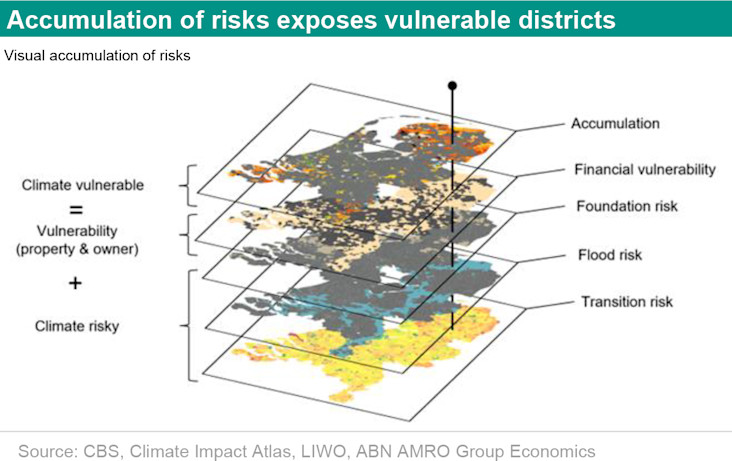
By linking data from BAG, Statistics Netherlands, Climate Impact Atlas and LIWO, high-risk districts in the Netherlands can be visualised. We classify districts as high risk on the basis of three criteria: if: 1) more than 10% of the homes in a district have a medium or high physical climate risk and/or if more than 60% of the registered labels are C to G; 2) the average property value (‘WOZ value’ is the property value assigned under the Dutch Valuation of Immovable Property Act) is less than €350,000; and 3) the standardised average household income is less than €35,000. Districts with a large percentage (70% or more) of owner-occupied homes will be particularly vulnerable in this regard. These criteria are partly determined by the distribution in the Netherlands at district level, where we always take the median value as the cut-off point. This median value was taken because the stacking gives good insight into the risk without the accumulation requirements excluding too many districts. Next, the analysis framework below shows how we arrive at classifying a district as high risk, where in these districts ‘climate-vulnerable’ means that there is a higher likelihood that residents will be less able to bear climate risks.
Risks of under/overestimation
The granularity of the data used gives rise to two causes of possible underestimation of risks. On the one hand, underestimation may arise because district-level data may contain outliers (some high-income households and/or very expensive properties) that cause vulnerability to be underestimated. In addition, as more layers of risk are stacked on top of each other, fewer households continue to be categorised as high risk or vulnerable. To our knowledge, this is the first study to stack all known risk layers with relatively high probability.
On the other hand, district averages may actually lead to overestimation, for instance, when the vulnerable households tend to live in rental properties and so are better protected against loss of value arising from damage than those households in owner-occupied properties. That clarification cannot be made at the district level: this is only possible if income, ownership and risk information is known at the individual and property level. Also, the data from the Climate Impact Atlas could lead to overestimation given that, for floods, actual failure* of flood defences, the way the system functions**, and emergency measures and contingency plans have not been taken into account.
(* The definitions used to determine a probability of flooding is based on the ‘onset of failure’ of a flood defence and not the actual failure, so the actual probability is a lot smaller. ** If a barrier were to break at site X, the probability of it breaking at site Y is reduced. This leads to an overestimation of the probability of occurrence.)
In our approach, we tried to minimise the risks of under and overestimation by doing a similar analysis based on internal data on our mortgage customers, in which individual data on customer, collateral and the loan were analysed. These data are confidential but they give us confidence in the correct risk assessment of the publicly available map layers, as the districts we define as ‘climate vulnerable’ also emerge as such from our internal, more granular analysis.
Results: Climate-vulnerable districts mapped
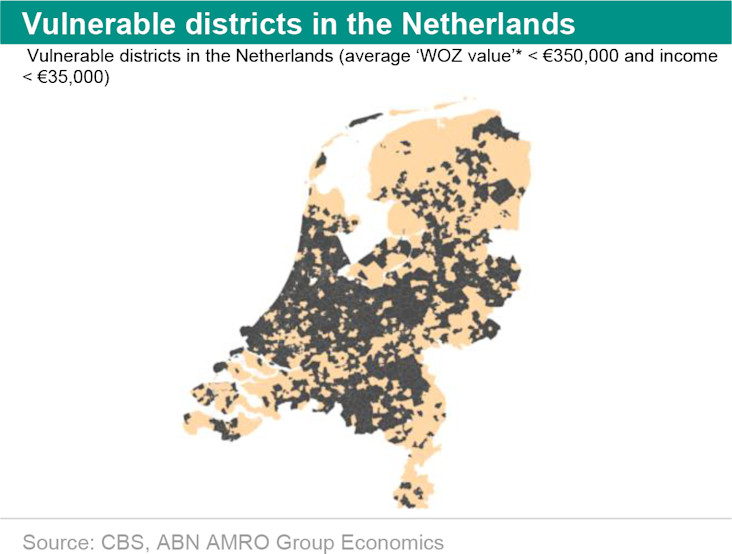
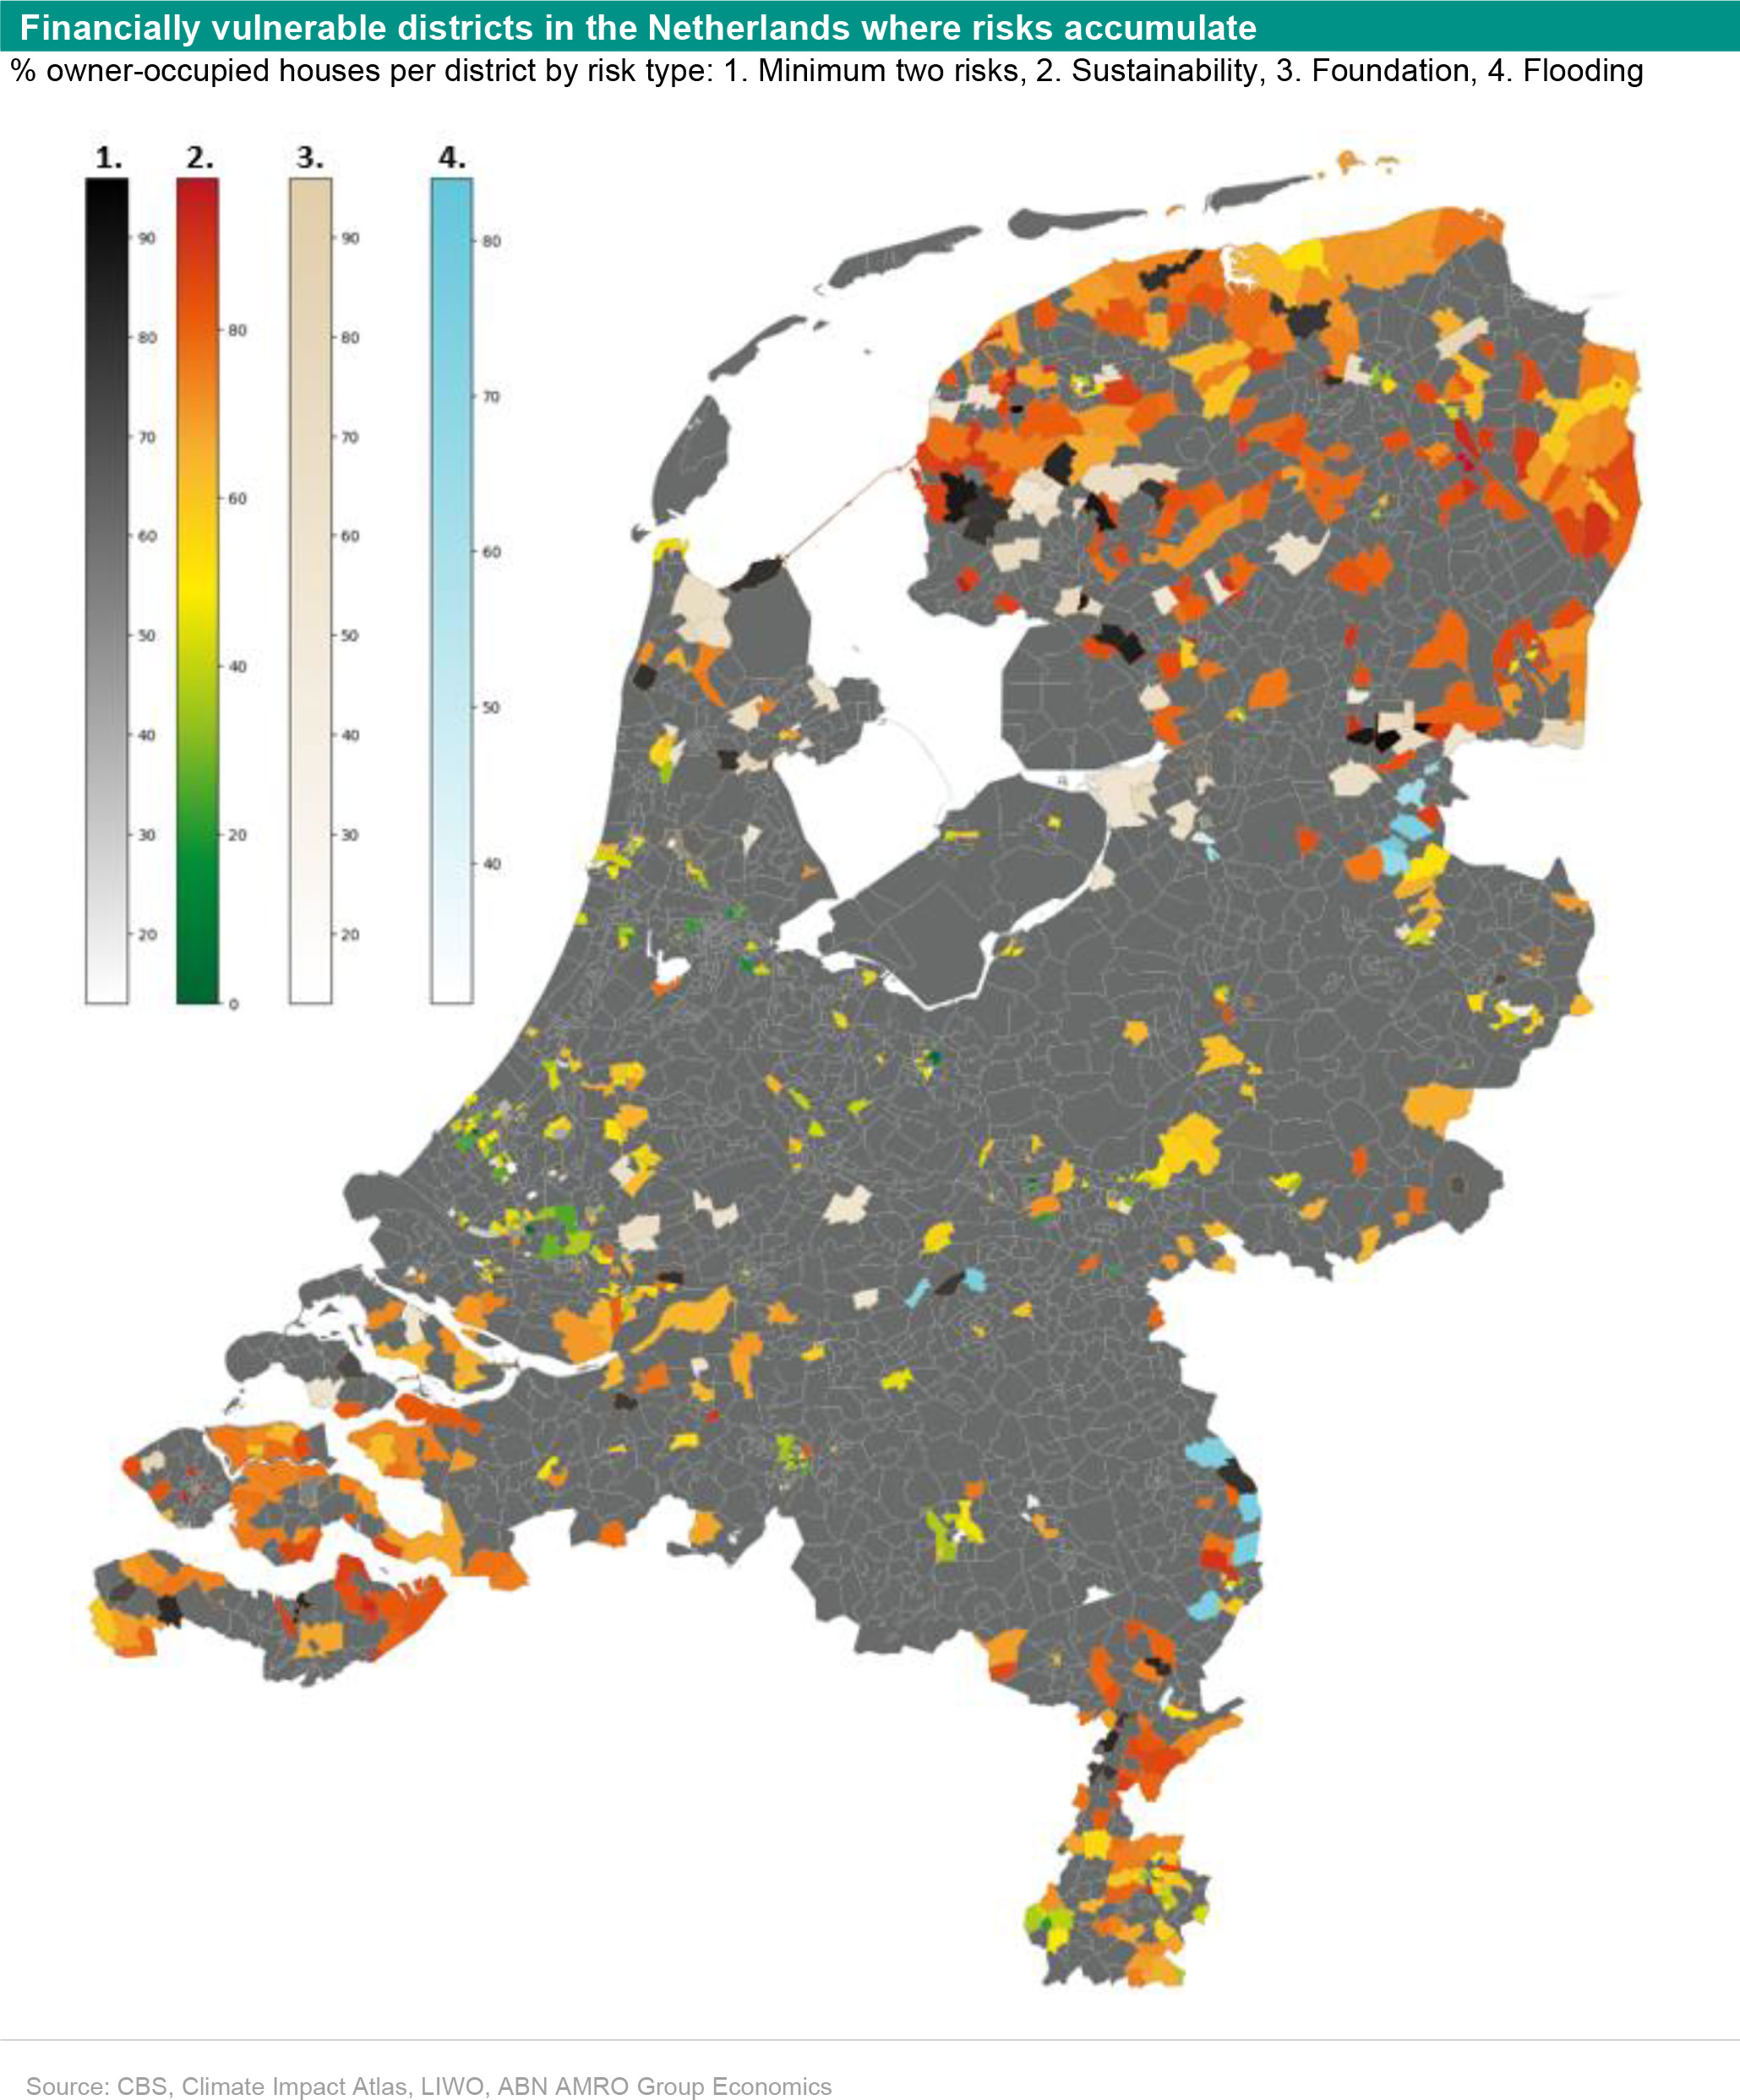
The map below shows where the risks of flooding, foundation damage and low energy efficiency coincide with financial vulnerability. For flooding, it can be seen that vulnerable homes and households are mainly concentrated along the Meuse River. The property value and income are on average lower in the Province of Limburg than in the rest of the country, and the percentage of owner-occupied homes here is on average high. This makes residents of these districts vulnerable.
A different picture can be observed for foundation risk. The high-risk areas can be found more in the north and west of the country, with the exception, for the west, of districts in Amsterdam, The Hague and Rotterdam. This is because the average household income and average property values are a lot higher in these districts. In addition, the percentage of owner-occupied houses in big cities is a lot lower than in the rest of the Netherlands. It is likely that households in big cities can handle the costs of the damage themselves or that the landlord assumes it for them and that it is sufficiently economically worthwhile to repair damage to the home.
Despite the fact that tenants are better protected legally, they are still at risk. Tenants will not have to directly pay the repair costs for the building, but they will be faced with the costs of damage to their home contents. It is also questionable whether the landlord can cover the costs of damage to the home. If repairs are delayed, the property may become uninhabitable, and though the tenant may not be at financial risk, they will still have a problem. Also, in the case of repair, the landlord will pass on the costs to the tenant in the form of higher rent where and when possible. So, though the tenant will not be affected as much as the landlord, they still face some form of risk.
The vulnerable districts combined with a large sustainability challenge are mainly located well away from the central region of the Netherlands. Large parts of the provinces of Zeeland, Limburg, Groningen and Friesland are particularly vulnerable. Here, energy labels are on average much lower and vulnerable districts face high costs for implementing energy efficiency measures. Also, for some districts, the percentage of owner-occupied homes is high, leaving the homeowners facing the costs.
Finally, there are also districts where two or more risks accumulate. In most cases, this is the combination of a large number of houses with low energy labels and a high risk of flood or foundation damage.
Conclusions and recommendations
When analysing the physical risks potentially facing households, the value of the homeowner’s collateral and their financial resilience are also important. To be truly comprehensive, not only will analysists/researchers have to identify as many risks as possible on a location-by-location basis, they must also take into account the financial resilience of both properties and residents. Our analysis does exactly this by depicting ‘climate-vulnerable districts’, combining the risks facing owners with the ability to pay. In a follow-up study with housing market experts from Rabobank and ING, we plan to go one step further by also analysing the regional and macro-economic effects of this risk stacking. In a second follow-up study, we will bring out a better estimate of the distribution of energy labels after the energy crisis. Based on this, the pathway the Dutch private housing stock still has to take in terms of becoming energy efficient can be estimated more accurately.
1 Where are the risks greatest?
The main insight gained through this study is the clarification of which districts need extra attention. The study reveals where households may struggle with the financial burden of possible loss and/or damage, as well as where it may not be profitable enough to repair homes. A good next step for policymakers (local/provincial/national) is to start mapping the risks as well as the repair options for each property within the districts with the highest accumulation of risks. This requires customisation and it requires that the many stakeholders in these areas address climate risk challenges together. Property owners, banks, housing associations, insurers and government agencies at municipal and provincial levels will have to come together.
2 Fair sharing of climate costs between current and future owners
A second insight concerns cost sharing. Awareness of where risks accumulate gives rise to a price discount, with which future owners can finance repairs. Because the known risks will increase rather than decrease with time, it is fair to have current owners pay for the currently known risks as soon as possible. Any future increase in risks and the associated discount further down the road will be borne by future owners.
The lack of knowledge and awareness among current and prospective homeowners, as well as other actors such as the mortgage lender, advisor or real estate agent, slows down adaptations and the resilience measures needed to mitigate loss and/or damage. This study shows that it is necessary to raise awareness about climate risks among all actors to start addressing the climate risk challenge. For those homes in climate-risk districts where there are few market transactions and a market correction is less likely to occur, it may be prudent to properly inform current homeowners about the potential change in the value of their collateral (property) and their options for value restoration.
3 Preventing climate inequality
To prevent financially vulnerable households from moving to districts where property prices are lower due to the climate risk being priced in (and therefore being unable to bear the costs of repair when the next flooding/foundation problem arises), it would be a good idea to include the potential buyer’s ability to pay for damage repair one of the topics discussed during the mortgage consultancy session.
For districts where the carrying capacity of current owners is already far from sufficient to deal with climate risks, the sustainable foundation repair fund could be considered. Possibly, this fund could be used more broadly to address the combination of physical and sustainability risks together in climate-vulnerable districts. For example, foundation repairs could be carried out in such a way as to connect geothermal heat at the same time to make the house more energy efficient.
To make/keep these climate risks insurable, it is essential that insurers not be permitted to exclude policyholders based on postcode or district data. A risk equalisation agency (similar to the Dutch National Health Care Institute for health insurance), which would make selecting policyholders based on ‘good risks’ not profitable, could be a solution worth exploring further.
4 Awareness in districts not deemed to be ‘risky’
This study is also important for districts where there is no accumulation of risks. Increasingly, a doomsday image of a Netherlands facing a series of insurmountable disasters is emerging, with global climate maps showing increasing sea levels in the Netherlands having the same disastrous effects as is seen in Bangladesh or the Philippines (where there is little coastal protection). The level of detail of KNMI risk maps, for which IPCC scenarios have been interpreted according to the situation in the Netherlands, show a more nuanced picture: a relatively small proportion of homeowners are at medium or high risk of financially unprofitable ‘irreparable’ damage to homes. Again, it is important to be aware of this to avoid a risk premium being required in the Netherlands by, for example, investors who are guided by maps with NAP elevation (land elevation) as a risk indicator. Such a means of estimating the level of risk is not useful for comparing the Netherlands with other countries: this often does not include the natural coastal protection, dykes and flood defences you see in the Netherlands.
5 Follow-up research: adding macro and meso effects and sustainability measures
In this study, although we took a holistic view of the accumulation of risks, we also had a narrow focus, namely the direct damage/cost to properties and the affordability of that damage/cost. However, the overall picture of economic damage in a climate disaster or large-scale foundation problems is bigger. Damage to commercial buildings and infrastructure can affect business operations. Furthermore, there may be knock-on effects such as households consuming less because their home has decreased in value, which in turn can cause a decline in local economic growth. In a follow-up study together with economists from Rabobank and ING, we are looking at the holistic picture of the channels of impact that can be present with climate risk.
