Is flood risk already affecting house prices?


Lessons learned from an impact assessment study in the Netherlands. Global warming increases the probability of flooding. If this risk is not reflected in house prices this raises concerns about a sudden risk re-pricing that may prove financially destabilizing. Our research findings are inconclusive but point towards current flood risks being not (fully) priced in to house valuations. The key methodological challenge in providing a robust estimate of flooding risk on house prices is finding comparable houses for the exercise, while still keeping the sample size sufficiently large.
Global warming increases the probability of flooding from either breaking or flooding barriers as the sea level rises or from more frequent and harder rainfall causing damage directly or via flooding rivers. The real estate sector in particular is vulnerable to this type of physical climate risk. Home owners, who commit themselves financially via a mortgage to the long term value of their home, should in theory be fully aware of the value reducing potential of current and future flooding probabilities. The question is: are they?
If they are, we would expect that the transaction prices of houses that are located in areas that are already today more likely to flood are lower than houses that are situated on land that is less likely to flood, all other things being equal. If they are not, this means that current and future potential damage is not (completely) taken into account. This is of great interest to banks as they typically have significant exposure to mortgages, investors in securities linked to banks, mortgages or the real estate sector as well as home owners. Knowing how physical risks of climate change such as flooding probabilities can affect the financial stability of banks and thereby the financial system will be part of a regulatory requirements from the ECB going forward.
Our research findings are intended to share the lessons learned in how to approach a question like this. We believe that an open exchange of trials and errors in research aimed at estimating the economic impact of climate change contributes to financial resilience of our clients, our bank and our economy. In this article we share our findings and the different empirical approaches we considered, we explain the limitations and recommendations for further research on this topic. For the complete publication see: LINK to flagship publication
Empirical Approach
In this observational study we focused on the causal impact of flood risk on house prices in the Netherlands. The main challenge when identifying causation is finding the right comparison. In our research setting, we only observe the sale price of a house with a given flood probability. We don’t know what the price of that house in that moment would have been had the flood probability been different. In other words, we don’t have a counterfactual, while the comparison of the observed house with it’s counterfactual would be the causal effect we are looking for.
To get around this problem, we compare house prices with different flooding probabilities (yearly probabilities of a flood >50cm) to each other, controlling for a suite of location- and property-specific characteristics. This cross-sectional method is widely used in historical literature on flood risk. We observe five different flood risk categories: no significant risk, extremely small risk (<1/30.000), very small risk (1/3000 to 1/30.000), small risk (1/300 to 1/3000) and medium risk (> 1/300).
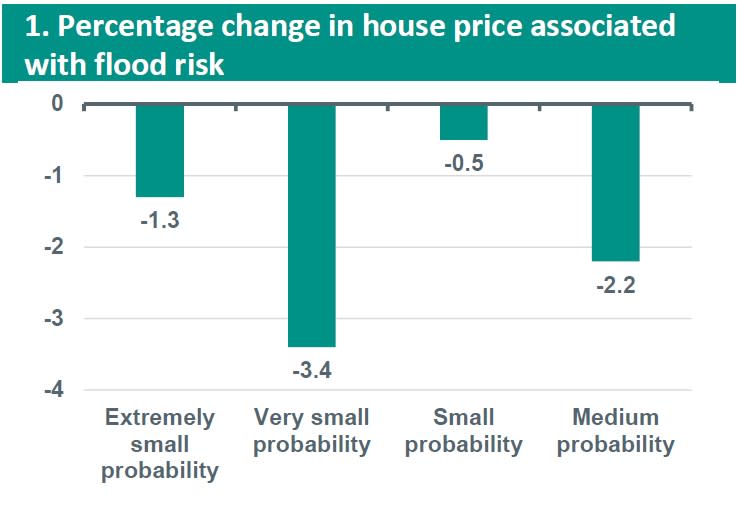
The figure below shows that properties with a medium >50cm flood probability have about 2.2% house price discount compared to similar properties without a significant flood probability. If people take flood risk into account when buying a house, you’d expect properties with a higher flood risk to have a bigger price discount. However, this is not what our results show. The biggest discount is found for the very small >50cm flood probability (1/3000 to 1/30.000) properties. This result seems unlikely. Although we have a large sample and we control for property and neighbourhood characteristics and make use of location and time fixed effects, it’s likely that these results suffer from omitted variable bias.
Omitted variable bias
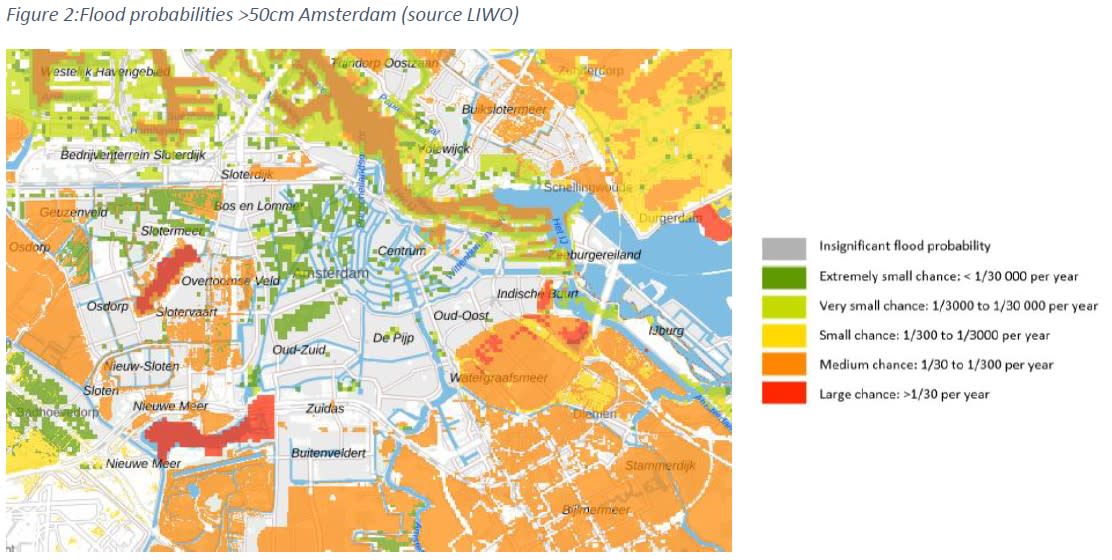
To understand the omitted variable bias better, it’s useful to have a closer look at the flood probability map. The below figure shows the flood probabilities for Amsterdam. Within Amsterdam there are differences in house prices depending on the area, with Amsterdam city center being more expensive than the outer part. So, for this area we are capturing something else besides flood risk in our regressions, namely houses in the outer area have a discount compared to the city center.
Source: Landelijk Informatiesysteem Water en Overstromingen (LIWO)
Improving the comparison
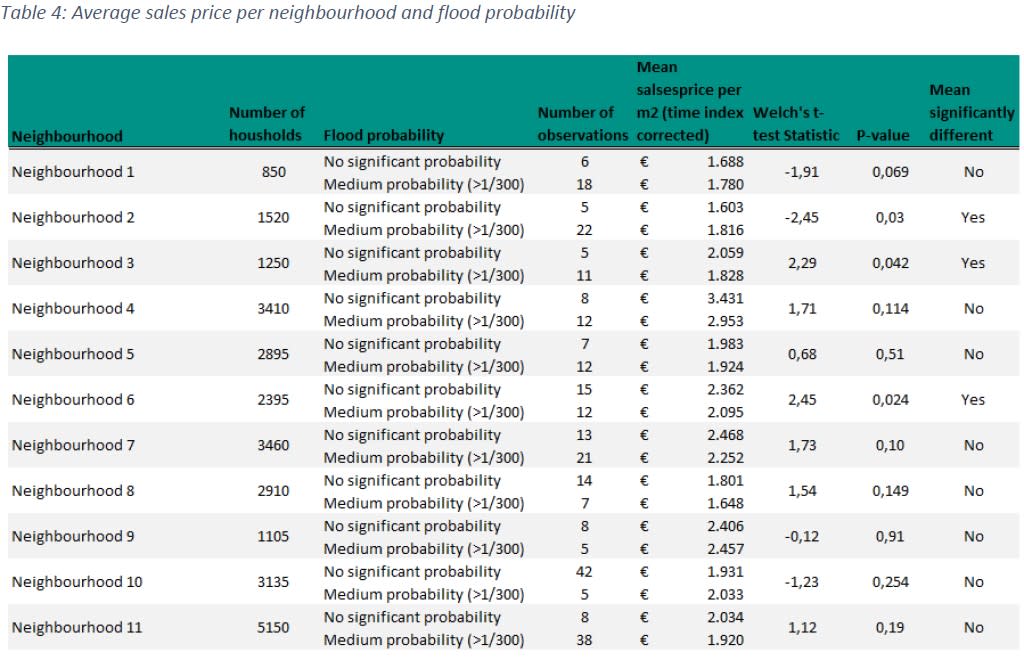
Apparently, we are not comparing similar houses. Therefore, we zoom in more locally to neighbourhood level (in Dutch: “buurt”). We only select those neighbourhoods with at least 5 properties with a medium flood probability and at least 5 properties with no significant flood probability. This reduces the sample to only 294 properties in 11 different neighbourhoods. Here we find in only 3 of the 11 neighbourhoods a statistically significant differences in house prices, two times a lower average sales price for houses with a flood risk and one time an average higher price for the houses with a flood risk.
Source: ABN AMRO Group Economics
Lessons learned the challenge of finding the right comparison while keeping sufficient observations
Main challenge in impact evaluation is constructing the “right” counterfactual. We used a cross-sectional method to analyse the impact of flood risk on house prices. In order to construct a convincing counterfactual using a cross-sectional method all confounding factors need to be included in the regression model. Unobserved characteristics that are correlated with both the flooding probabilities and sales price cause an omitted variable bias. And indeed, our analysis confirms that our initial model suffered from omitted variable bias.
In order to overcome this issue we improved our comparison by exploring flood risk variation on a more local level. When only looking at houses with different flood risk probabilities within the same neighbourhood we do not find that flood risk is priced into the residential real estate market. This could be concerning because it would tell us that home owners who do not consider current potential losses from flooding are bound to not take future losses from flooding into account at all. For locations where future losses are estimated to increase through increasing flood risk, there is the risk of a sudden price correction. Whether and how this affects client’s, the bank’s and the economy’s financial resilience is not known today.
These research findings are not allowing for any firm conclusions. More research is need, given the importance of the topic. The key challenge to overcome is finding the right comparison of houses without losing too many observations. As location is extremely important for valuation, the right comparison comes down to comparing properties that are as close to each other as possible. One way would be to follow a property’s sales price over time while the flood probability changes. This would require a repeated sales data set with varying flood probabilities over time. We do not have these data. Another option is a comparison of properties using a border discontinuity design. With sufficient observations on a high proximity to each other, this is feasible. In general, including more property and location specific characteristics would improve the comparison.
Thanks to Bram Vendel, Christiaan Schreuder and Tamer Kara of ABN AMRO Mortgages for their input.


