Macro Watch - Wage growth: How far does it need to fall?

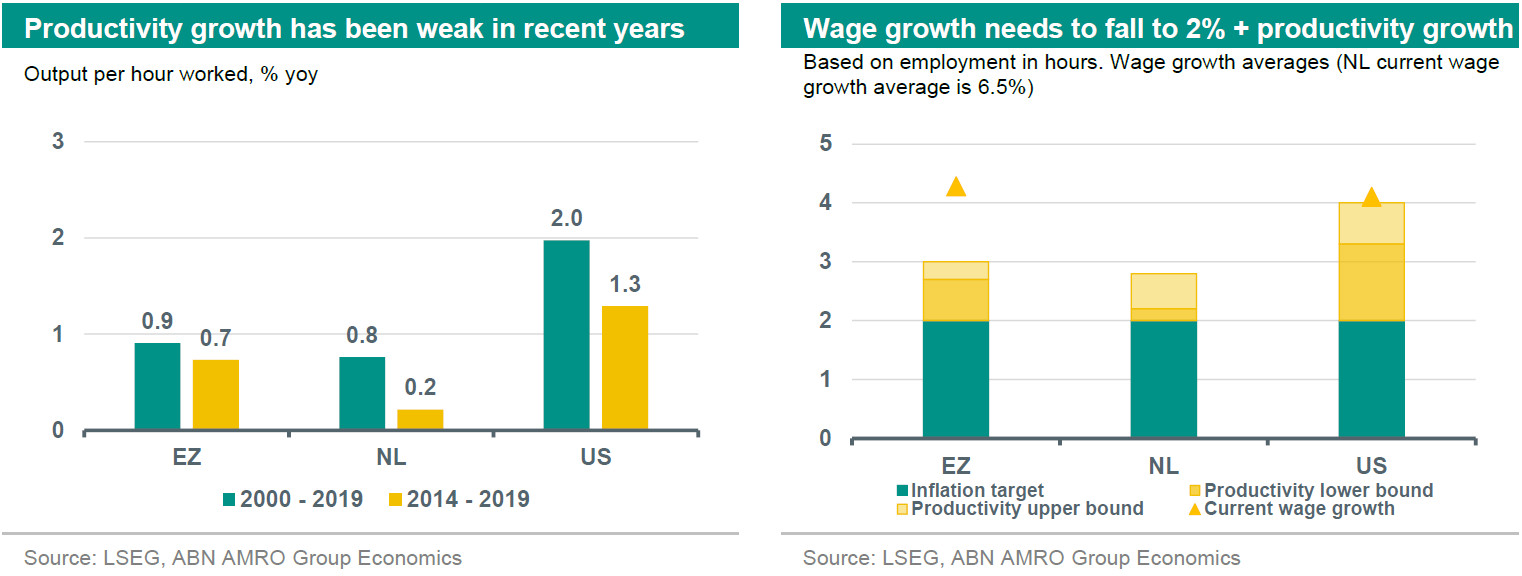
The key to disinflation continuing will be a timely normalization in wage growth. We estimate wage growth needs to fall to ranges of 2.7-3.0% for the eurozone, 2.2-2.8% for the Netherlands, and 3.3-4.0% for the US in order for to inflation to fall to – and stay at – 2%. But central banks will likely cut rates before wages fall this far – otherwise they could be too late. This is due to the lags with which monetary policy affects the economy.
Wage growth is driven by future inflation expectations, labour market tightness, and the catch-up of nominal wages and the price level. We take stock of developments in these channels
Wage growth in the eurozone still has a significant way to fall, and Q1 data will prove key
Businesses likely have space to accommodate some further increases in wages, meaning wage growth does not immediately have to fall back to target-consistent levels
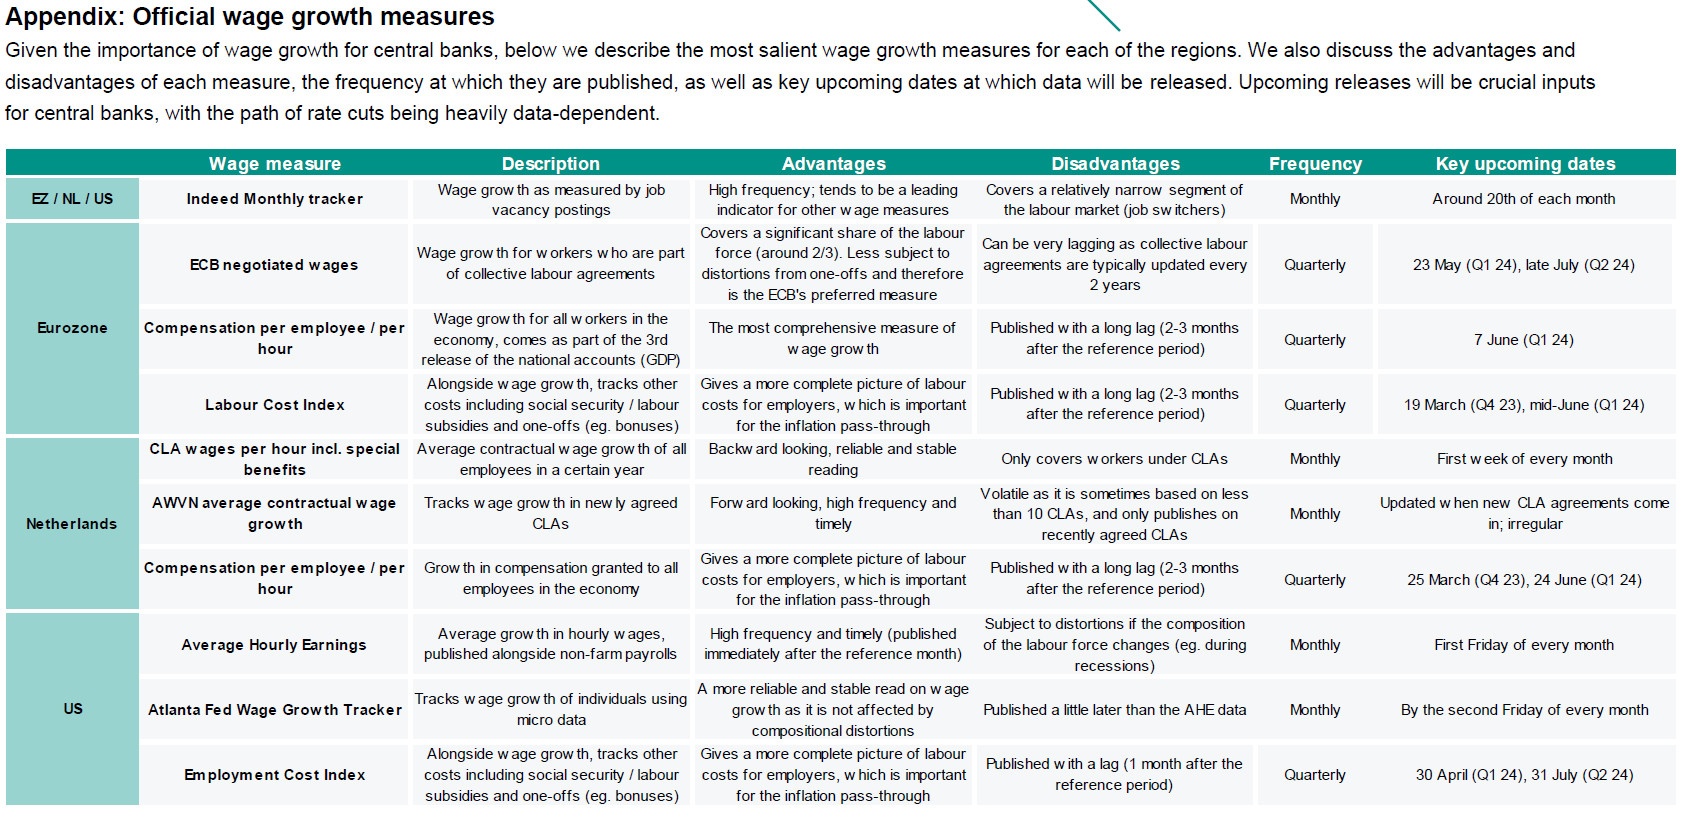
We include an Appendix in which we explain the various measures of wage growth
Timely normalization in wage growth key to disinflation continuing
On one thing the major central banks are agreed: the key to disinflation continuing will be a timely normalization in wage growth. Although wage growth has not been a major driver of inflation so far, the risk that its catch-up could keep inflation above 2% targets is the one that keeps central bankers on guard. On the back of the inflation surge and in combination with labour market tightness, wage growth started to increase from late 2021 onwards. In the absence of corresponding productivity gains, elevated wage growth adds to firm cost pressures which need to be either passed on to consumers or absorbed in profit margins. This is particularly so for the labour-intensive services sector. This was recently echoed by ECB board member Isabel Schnabel in an : “We are observing a slowdown in the disinflationary process that is typical for the last mile. This is very closely connected to the dynamics of wages, productivity and profits.”
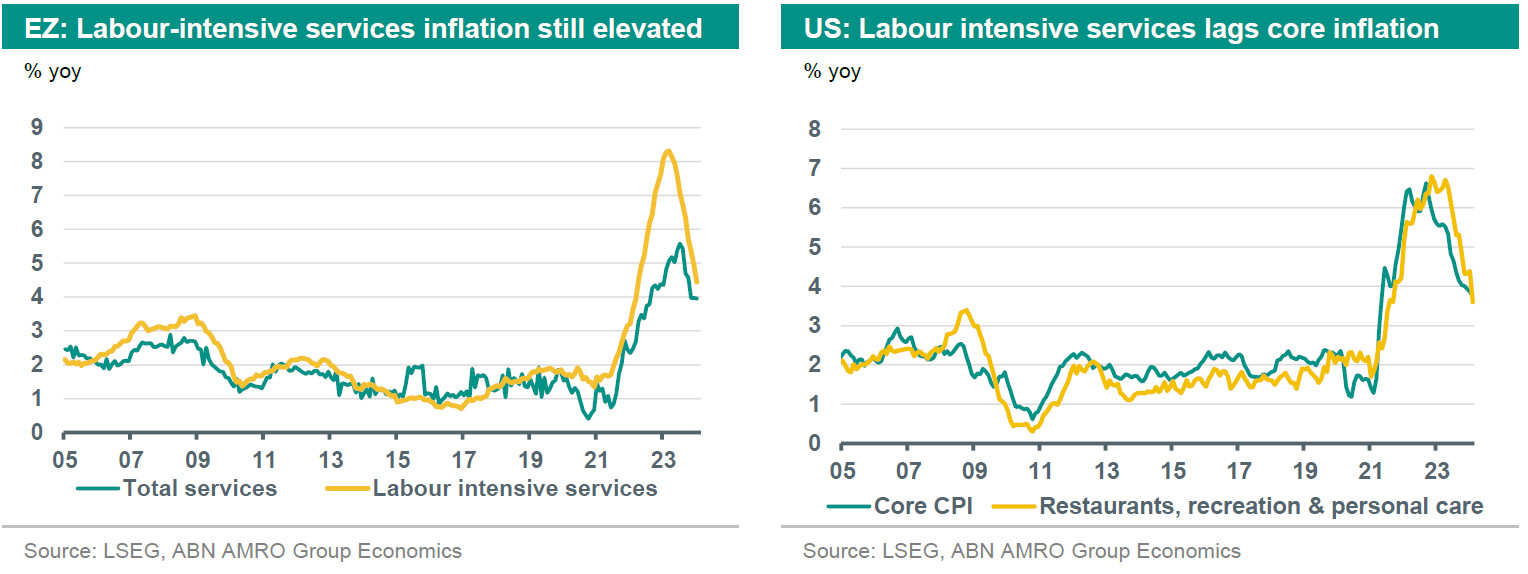
Generally, disinflation has continued in advanced economies. Despite some recent hot CPI inflation reports, the Fed’s preferred measure – PCE inflation – is already at the 2% target on a 3m/3m annualised basis. According to the same measure core HICP inflation in the eurozone has been close to 2% since November 2023. Although the impact of goods and energy – the main drivers of disinflation so far – will fade, we already see the beginnings of a decline in services inflation. More specifically, for labour intensive services in the US, inflation remains somewhat elevated but it tends to lag broader core inflation measures and is on a steep downward trend. For the eurozone, services inflation is coming down, but labour-intensive services inflation is still well above 2% targets. An equivalent story is observed in the Netherlands.
In the long-run, in order for central banks to meet their 2% inflation targets, wage growth needs be at a level equivalent to 2%, plus long-run productivity growth. In the US, wage growth is close to target levels on a number of measures, but in the eurozone there is still a way to go. We think that eurozone wage growth will moderate in the coming quarters, as labour market conditions have deteriorated due to the much weaker economy on this side of the Atlantic, and wage growth according to various measures has peaked. However, there is uncertainty over how quickly this normalisation will unfold. Below, we assess how soon central banks can be confident that wages are falling back to 2%, and the risks that wage growth could be stickier.
Where does wage growth need to fall back to?
We first need to define the level wage growth needs to fall back to in the long run for central banks to be confident that inflation goes back to – and stays at – 2%. As described above, this level of wage growth is equivalent to the inflation target of 2% plus long-run productivity growth. As productivity is volatile and challenging to predict, central banks look at long-term trends. To come to a ballpark estimate, we looked at both longer run (2000-19) and shorter run (2014-19) productivity growth, avoiding the recent pandemic and energy crisis periods due to the distortions of those shocks. Based on both the short- and long-run estimates of productivity, we estimate wage growth target ranges of 2.7-3.0% for the eurozone, 2.2-2.8% for the Netherlands, and 3.3-4.0% for the US. In the period before the pandemic, wage growth was lower than the upper bounds of these target ranges, but at that time central banks actually faced the problem of too low inflation. We therefore think central banks would not need to see wage growth fall back to pre-pandemic levels, but rather to something within – or even a little above – these estimated target ranges.
There are risks to these productivity assumptions. As we wrote in a previous publication (see here), it is likely that the adoption of AI will boost productivity, but this may take time. Given the uncertainties, our base case does not assume an AI-driven productivity boost in the short-term, but AI could prove an upside risk to the productivity range. This could allow wage growth to land at the upper end of the ranges indicated – or even higher – without inflationary consequences. However, there are also downside risks to productivity assumptions. For instance, from the shift to services from industry (it is generally harder to raise services productivity due to its high dependence on labour), while the energy transition and climate change may hamper economic growth and therefore productivity. This would mean wage growth needs to fall back to the lower end of our specified range in order for inflation to sustainably hold at 2%.
Inflation expectations, labour market, and real wage catch-up determines wage growth
Wage growth is driven by future inflation expectations, labour market tightness, and the catch-up of nominal wages with the price level. The relative impact of these channels can vary over time. In ‘normal’ times, labour market tightness would be the main driver. However, inflation expectations appear to be the most important driver at the moment – particularly in Europe. This is due to the unusual shock to real incomes caused by the energy price surge and supply chain disruptions. We assess the current status of these channels below.
1. Inflation expectations
Inflation expectations can influence wage growth both in the short run and the long run. In periods of high inflation, workers may seek compensation for their (expected) loss in purchasing power. This can happen even when longer-term inflation expectations remain well-anchored and workers also expect inflation to come down in the longer-term ().
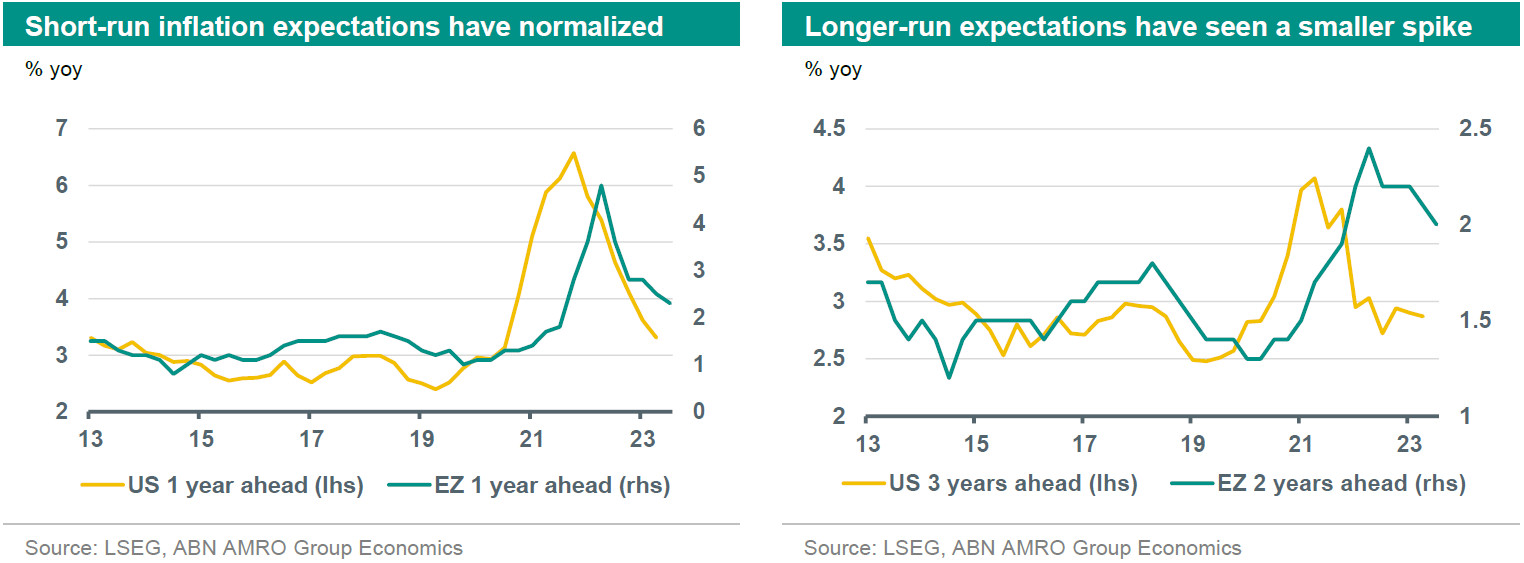
For the eurozone (the Netherlands included), short-run inflation expectations spiked in the aftermath of the pandemic in late 2021 and as the energy crisis unfolded in 2022, with sharp rises in wage growth quickly following. However, these short-run expectations have now largely normalised. In the US, the spike in inflation expectations came sooner – driven by a stimulus-fuelled surge in consumer demand, but also in the US, short-run expectations have returned to their pre-pandemic average.
The big fear of central banks throughout this period was that higher short-run inflation expectations would push longer-run inflation expectations higher, leading to structurally higher wage demands from workers. Fortunately, this has not – so far –materialised. While long-run inflation expectations are indeed higher than before the pandemic, the magnitude of the rise was much smaller than that for short-run inflation expectations, and long-run inflation expectations are now back at levels consistent with the 2% targets of central banks.
All in all, if workers do not expect a repeat of the inflation surge of the past two years, one of the main arguments for wage demands to persist at the current elevated rates is weakened.
2. Labour market tightness
In normal times, the main driver of wage growth is labour market tightness. Broadly, when demand for labour is greater than supply, the price for labour – wages – is bid higher. How do we measure the supply and demand for labour, and therefore labour market tightness? The most obvious indicator – and the figure most commonly cited in the media – is the unemployment rate. But, as an by Bernanke & Blanchard last year showed, stability in the unemployment rate can sometimes mask major shifts taking place below the surface in the labour market. They argue that the ratio between job vacancies (representing labour demand) and unemployed (representing labour supply) – let us call this the vacancy ratio – can have greater explanatory power for wage growth than the unemployment rate alone.
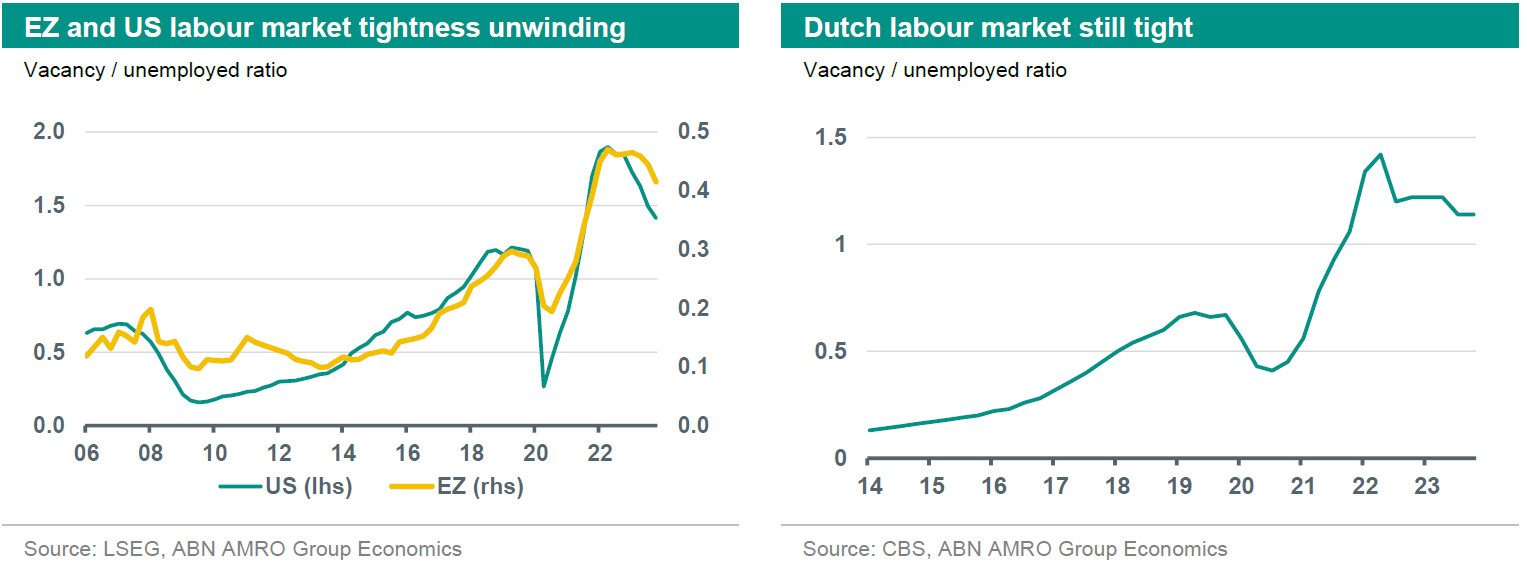
In normal times, the unemployment rate and the vacancy ratio move almost perfectly in tandem (with an inverse relationship). The pandemic changed that. In the US, the unemployment rate on the eve of the pandemic in early 2020 was 3.6% – exactly the same level as in early 2022. In the eurozone the unemployment rate was only a few tenths lower in 2022, at 6.8% compared with 7.2% just before the pandemic. The unemployment rate therefore implied little change in labour market tightness. However, as the charts below show, the vacancy ratio shifted dramatically over that period, driven largely by a jump in job vacancies – but also, in the US, by a fall in labour force participation.
Since early 2022, central banks raised interest rates at the steepest pace in decades, partly in an attempt to cool excess demand for labour. This has helped drive a significant turnaround in the vacancy ratio – particularly in the US, but also in the eurozone. Having peaked in early 2022, the number of job vacancies per unemployed person in the US fell from a historic high of 1.9, to 1.4 as of January this year – now not far above its pre-pandemic level of 1.2. The vacancy ratio in the eurozone has also clearly turned a corner, albeit from much lower levels. The drop in the vacancy ratio has been helped by both falling job vacancies – reflecting cooling labour demand – as well as a return of workers to the labour force (in the case of the eurozone, participation is actually higher than before the pandemic). Remarkably, this turnaround has occurred without any meaningful rise in the unemployment rate, while wage growth has cooled in tandem with the falling vacancy ratio. This appears to support the Bernanke-Blanchard thesis that the vacancy ratio is a better indicator of labour market tightness when predicting wage growth than the unemployment rate.
3. Real wage catch-up
The catch-up of nominal wages and the price level is another factor determining wage growth. In normal times wage gains keep up with inflation, so that real wages grow in line with productivity. In Europe, however, the shock of the energy crisis led to a sudden loss of purchasing power among workers, and because this was caused by an external negative terms of trade shock (the loss of Russian gas supply), wage growth was unable to immediately compensate for this (1). Despite being caused by an external shock, workers still sought to make up for this purchasing power loss by demanding higher wages, and this has arguably been the main driver of the spike in wage growth over the past two years. However, as we describe in our February Monthly (see here), we now see evidence that inflation is being cited less frequently in collective wage bargaining negotiations. Wage growth takes time to accelerate, but it also takes time to cool back down again. It may therefore be helpful to take stock of how much catch-up has already taken place in order to assess what could still be in the pipeline.
At the eurozone aggregate level, wages have not fully made up for the blow to purchasing power created by the energy crisis, which indicates that there is still some catch-up in the pipeline. However, this does not include temporary measures by the government, which to some extent have compensated households for their loss of real income. Estimates by the IMF, OECD and ECB suggest fiscal support measures have largely made up for the purchasing power gap, though these were mostly one-off and did not permanently raise incomes.
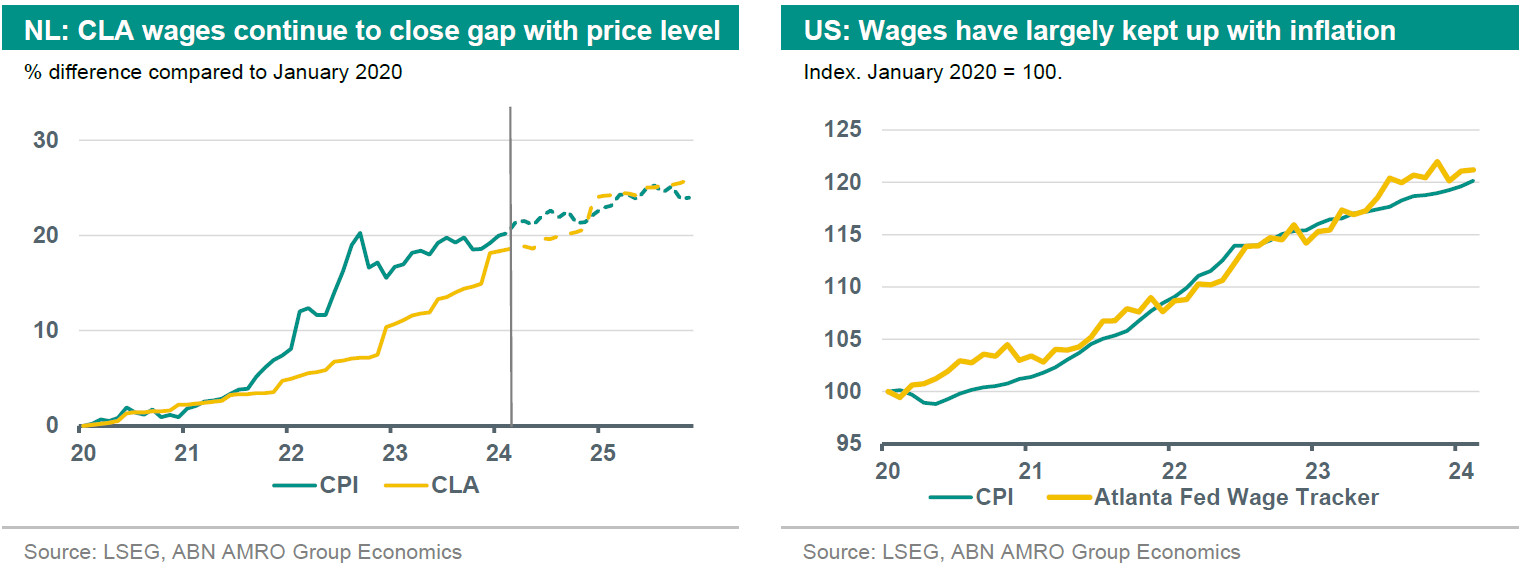
In the Netherlands specifically, Collective Labour Agreement (CLA) wage growth has been lagging CPI developments since the start of 2020. The peak gap between wages and prices was at 13.1% in October 2022. With high wage growth and the downward trend in inflation, household purchasing power is increasing again. Indeed, the level of wages has largely caught up with the price level, and the gap declined to 1.6% as of February. If we look ahead and include our estimates for wage growth and inflation, we expect that during the year the loss of purchasing power of recent years will continue to shrink.
In the US, wages have largely kept up with inflation, and wages are in real terms slightly higher than the pre-pandemic level. This is because the US did not face the same terms of trade shock that Europe did during the energy crisis; much of the high inflation was domestically generated.
What do the latest developments tell us?
There is a wide range of data that helps us to understand wage developments. We describe these measures – and their publication dates – in the Appendix to this publication. Looking at official wage growth measures and comparing these to the productivity-based target ranges discussed above, wage growth in the eurozone still has a significant way to fall. The Indeed wage tracker – which uses salary data for posted vacancies – has proven to be a strong leading indicator. For the eurozone, official wage growth measures as well as the Indeed tracker are above the pre-pandemic levels, and well above the range to which we estimate wage growth needs to fall back to in the longer term. However, as profit margins in the eurozone are still elevated – particularly among large corporates – businesses likely have some space to accommodate further increases in wages; at least for a time. This has also been suggested by ECB officials, such as Klaas Knot: “there’s still space in profit margins to pay higher salaries without a drastic second round for price hikes” (see ).
Additionally, the weaker macro-economic environment in the eurozone is impacting the bargaining power of workers and should put meaningful downward pressure on wage growth over time. As explained in our February Monthly (see here), if we look at the fall in job vacancies, around half of the increase in labour market tightness since the pandemic has already unwound. As we expect the eurozone economy to stay weak, the softening in labour demand is likely to continue, and we expect a modest rise in the unemployment rate this year. This should help drive a further decline in wage growth.
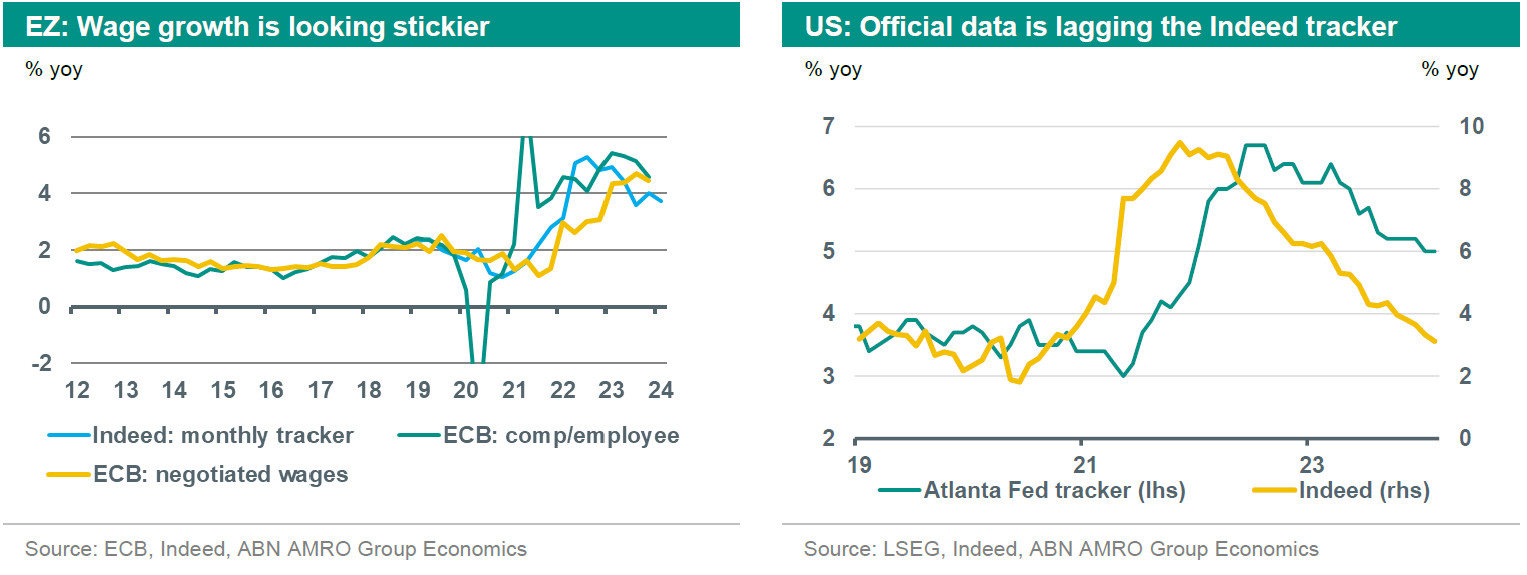
For the Netherlands, the Indeed wage growth tracker is still trending upwards. We think CLA wage growth marked a peak at 7.0% yoy in January 2024, and wage growth on this measure is now expected to slowly decrease. Although wage growth is still elevated, we do expect it to come down during the year on the back of decreased inflation expectations, and given that wages have now largely caught up with inflation. There is also anecdotal evidence that unions are scaling back wage demands in sectors where workers have already been compensated for the inflation surge.
On the surface, wage dynamics in the US already look much more benign than in the eurozone. The Atlanta Fed’s wage tracker is – at 5% as of February – still 1-1.5pp higher than it ideally should be. However, it is also a very lagging measure. Based on the relationship between the Atlanta Fed’s wage tracker and the Indeed tracker – which suggests that wage growth is almost back near 2019 levels – we think the former tracker will hit a wage growth level consistent with the 2% inflation target in the second half of this year. Similar to the eurozone, unemployment is low but the vacancy ratio measure of labour market tightness has eased significantly. With that said, the broader strength in the economy means there is a non-negligible (around 20%) chance that labour demand – and in turn wage pressures – in the US rebound. The solid anchoring of inflation expectations, and the broad normalisation in the labour market means we would not have this scenario as our base case.
When will we have enough evidence that eurozone wage growth is normalising?
2024 will be the year in which the Fed and the ECB start cutting rates. Essential to the timing of these cuts are wage growth developments. Overall, we think that by the summer, central banks will have enough convincing data on wages to press ahead with rate cuts, but that they will have to take a leap of faith in order to avoid the risk of being too late with rate cuts.
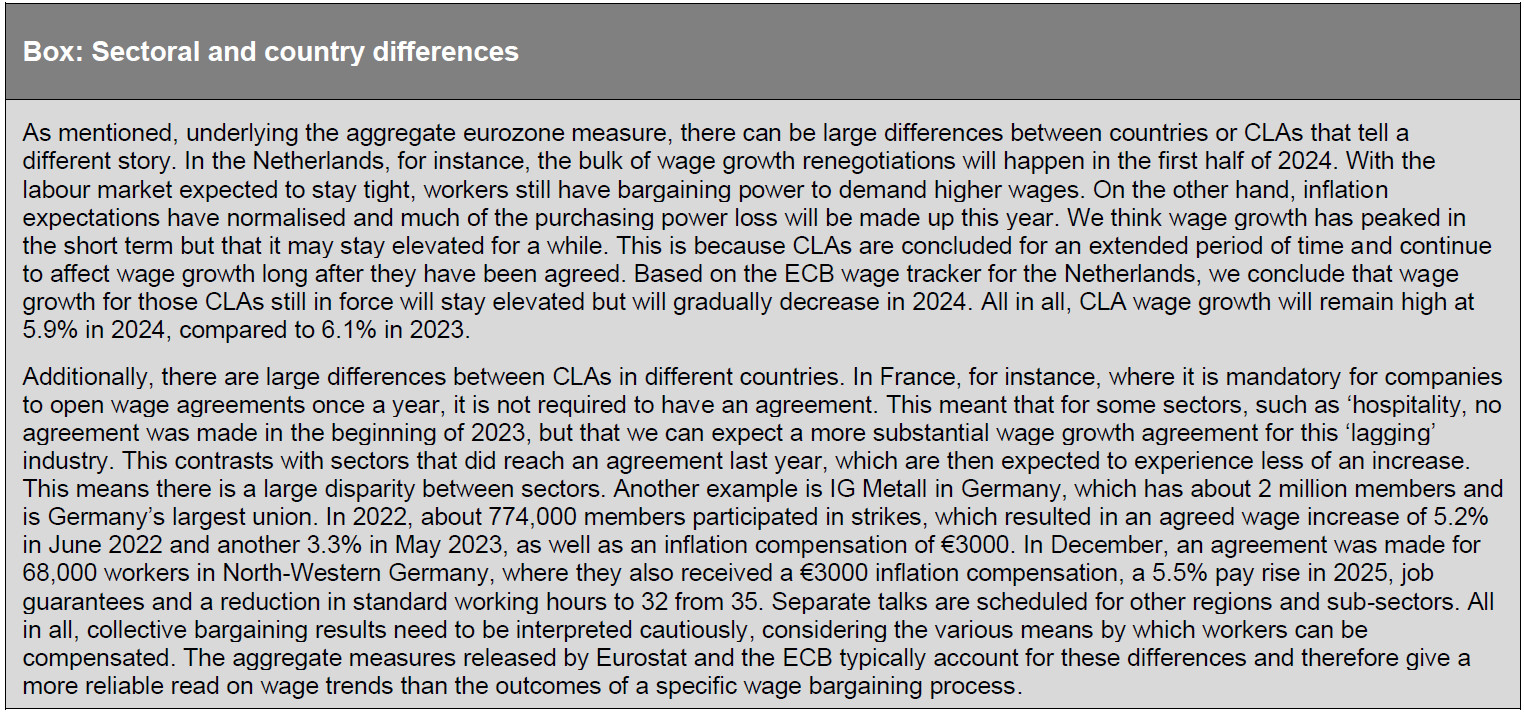
In the eurozone, wage growth in 2024 is largely determined by CLAs, with some having been already agreed, but many yet to be agreed. On the former, the ECB recently published a paper in which they describe a newly created ‘forward-looking tracker of negotiated wages’ (read the paper ). This wage tracker uses CLA agreements that are still active or newly agreed, and calculates what this means for future wage growth (2). The ECB tracker uses these agreements and the worker-coverage in CLAs to illustrate wage growth developments of still active or already agreed on CLAs. Based on the ECB tracker, the authors conclude that “Preliminary data for contracts signed in Q4 2023 covering 4.5% of employees in the euro area indicates an average growth rate of 3.6% in the next 12 months.” However, they also note that this weakening is largely driven by public sector wage agreements in Germany that are backloaded: only towards the end of 2024 will these workers see an increase. The ECB authors concluded that the wage trackers “show some plateauing of wage growth at high levels,” suggesting still some way to go in the cooling in wage measures.

The ECB wage tracker indicates that a large share of contracts are due to expire and are up for renegotiation in the first quarter of 2024. The outcomes of these negotiations will therefore be crucial determinants of wage growth for the rest of the year. The aggregate data will come in just after the June ECB meeting, but the outcomes of individual agreements should give an earlier indication of cooling wage growth. Given the three aforementioned channels of inflation expectations, labour market tightness and real wage catch-up, we think that by the June Governing Council (GC) meeting there will have been enough cooling in leading indicators of wage growth to give the GC the confidence that wage growth is on its way back to levels consistent with 2% inflation. As described earlier, however, the ECB will likely have to take a leap of faith given that monetary policy works with its ‘long and variable lags’. If it waits for wage growth to fall fully fallen back to target consistent levels, rates could stay too high for too long, risking unnecessary economic damage – or worse, a recession.

Conclusion
Throughout the recent high inflation period, the biggest fear of central banks was that the run-up in prices would trigger unsustainably large wage rises, which in turn would feed back into price growth, keeping inflation above 2%. As we have argued, we think that by June, central banks will have more convincing evidence that wage growth is normalising. Central banks cannot wait until wage growth has fully normalised, otherwise they will probably be too late with rate cuts. Following initial 25bp cuts in June, our base case sees the Fed and ECB following up with additional 25bp cuts at each policy meeting thereafter – making for a total of 125bp in rate cuts expected this year. Although wage developments seem unlikely to alter the timing of the start of rate cuts, if wage growth proves more sticky (in the eurozone), or rebounds (in the US), it could well lead to a slower pace of rate cuts than we currently expect. On the other hand, if wage growth continues normalising but the economy stays weak (eurozone) or weakens more than we expect (US), central banks could cut rates more aggressively.
(1) When a large negative terms of trade shock occurs – in this case, the loss of Russian gas imports – the hit to aggregate real incomes cannot be compensated for by nominal wage rises, because the factor underlying this (the loss of Russian gas) does not change merely because people’s wages are higher. This is more eloquently explained by Ben Broadbent of the Bank of England: “It’s understandable that employees and firms should want compensation for these losses, by raising wages and domestic prices. Unfortunately, and at least collectively, these efforts will not make us better off. The effect is to raise domestic inflation with no ultimate impact on average real incomes.” See for the full speech. Note that this negative terms of trade shock has since resolved itself, because Europe has been able to secure sufficient LNG to replace Russian gas supply. Wage gains can therefore now restore lost purchasing power.
(2) That is, some CLAs state that wages will rise in two steps, for instance: once in April 2024 by 1.5% and another time by 2% in May 2025.

