Global manufacturing struggles, weakness in DMs deepens


Global manufacturing PMI back in contraction territory. Weakness in developed economies deepens. Our global supply bottleneck index confirms global excess supply conditions continue. Container tariffs down again; industrial input/output price components well below 2021/22 peaks.
Global manufacturing PMI back in contraction territory
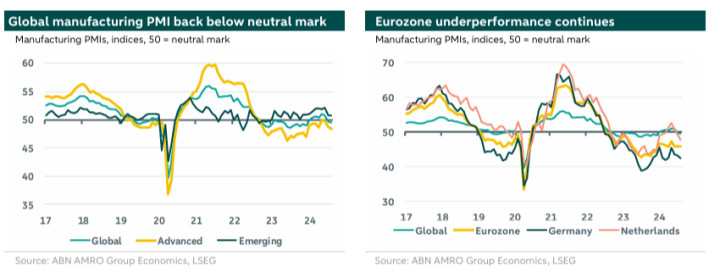
After having risen to a two-year high of 51.0 in May, the global manufacturing PMI has gradually come down again in recent months, dropping further below the neutral mark separating expansion from contraction in August, to 49.5 (July: 49.7). This shows that the bottoming out in global manufacturing is faltering. We have for long warned for too much optimism on the global manufacturing side, given our growth views for the key economies – with a (soft) landing in the US, only a modest pick-up after a year of stagnation in the eurozone and growth in China still being weighed down by the property sector downturn. That said, recent developments show that the weakness in some regions seem to have deepened again, particularly in the eurozone/Germany (probably aggravated by a loss in competitiveness stemming from the previous energy crisis – see our earlier analysis on eurozone competitiveness ).
Weakness in developed economies deepens
Although the softening in manufacturing PMIs in recent months has been rather broad-based, the weakness is still mainly concentrated in the developed economies. The average DM index fell to an eight month-low of 48.3 in August (July: 48.8), while the average EM index remained above the neutral mark, picking up slightly to 50.8 (July: 50.7). Amongst the DMs, the eurozone is still an underperformer (manufacturing PMI stable at 45.8 in August) – with Germany’s PMI falling back to a five-month low of 42.4. That said, also the French PMI is at low levels (43.9), while the index for the Netherlands has fallen back by almost five full points since May, to an eight-month low of 47.7 (see for more background ). Meanwhile, the manufacturing PMI for the US (47.9) has also weakened significantly since June. The UK (52.5) currently is a positive outlier amongst DMs. Some caution on the EM side is justified as well: the improvement of the EM aggregate index is partly driven by a pick-up of Caixin’s manufacturing PMI for China to 50.4 in August, but China’s alternative ‘official’ index equalled an eight-month low of 49.1 (see our coverage ).
Our global supply bottleneck index confirms global excess supply conditions continue
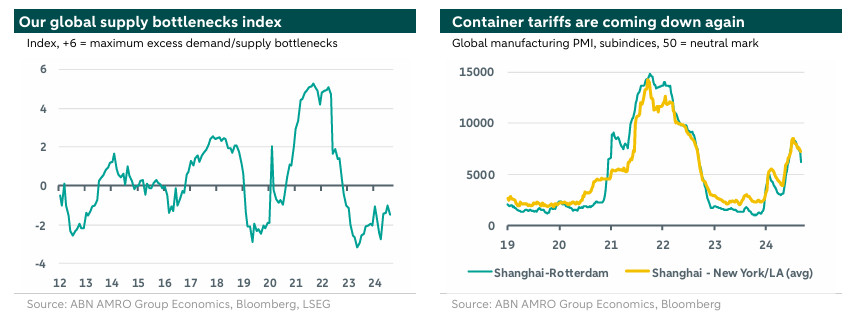
As indicated by the various components of the global manufacturing PMI, the supply side is also losing strength, but the demand side remains weaker. The global output subindex dropped back to (just) below the neutral mark (49.9), the softest reading since December 2023 (driven by DMs). On the demand side, the global orders subindex stabilised at 48.8, while the global export orders component fell to an eight-month low of 48.4. These developments are also still visible in our global supply bottlenecks index, for which an excess supply/demand metric is one of the key components. Our global supply bottlenecks index remained in excess supply territory in August, although other components of this index (particularly container tariffs, but also delivery times for electronic equipment) have – on balance - moved this index a bit towards ‘neutral’ since April 2024.
Container tariffs down again; industrial input/output components well below 2021/22 peaks
Despite ongoing disturbances in global shipping routes and the previous spike in container tariffs, the ongoing global excess supply conditions mentioned above will likely keep a lid on cost push price pressures from global manufacturing. Note that global container tariffs have started coming down again over the past few months, likely also driven by ongoing additions to shipping capacity. What is more, as we have stated before, higher freight tariffs by themselves are unlikely to move the needle on global goods inflation much, given the small contribution shipping costs make to the final cost of a good (around 1% on average). More broadly, the current disturbances in global shipping are not comparable with the broad range of disturbances in global production and transport during the pandemic episode, at times when global demand conditions were also stronger. The global manufacturing PMI’s components for input and output prices – bellwethers for cost-push factors in global industrial goods’ prices – have come down a bit since June, and are still well below their peaks seen in seen in 2021/2022.

