Global manufacturing shows further improvement


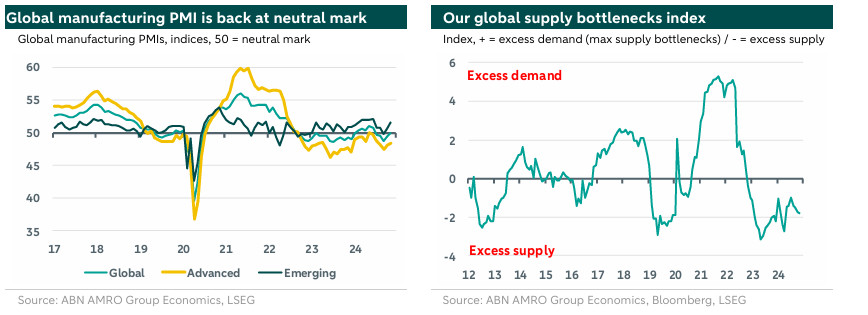
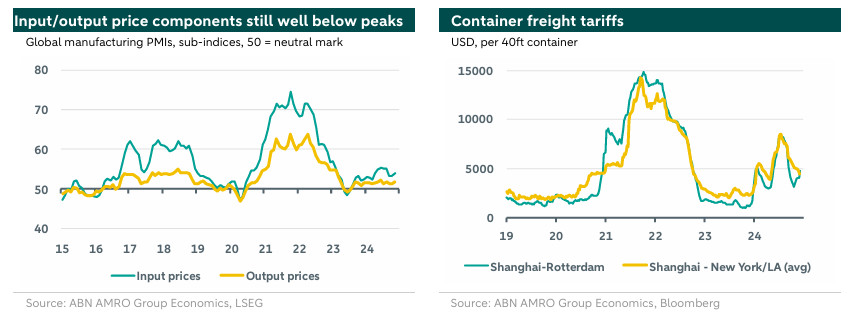
Global manufacturing PMI rises back to ‘neutral’. EM outperformance continues, Demand picks up (also driven by EMs), and global excess supply continues. Subcomponents for input and output prices up, but remain far below 2021/22 peaks.
Global manufacturing PMI rises back to ‘neutral’
The global manufacturing PMI has risen for the second month in a row, climbing back to the neutral 50 mark separating expansion from contraction in November, up from 49.4 in October. This follows a period of weakening over the summer months. The recent stabilisation in global industry seems to be in sync with the easing cycles in key economies seen over the past few months. (Preparations for) trade frontloading in the run-up to an expected rise in US import tariffs next year may have played some role in the improvement seen in November, and may support a further rebound in global manufacturing and goods trade in the short-term. Longer term, in the course of 2025 and in 2026, we anticipate headwinds from a trade tariff shock to drive a slowdown in global GDP and (goods) trade, which is likely to form a headwind for global industry as well – see our .
EM outperformance continues
In terms of geography, the improvement seen in November was broad-based, but there is still a clear discrepancy between EMs (in expansion territory) and DMs (still in contraction territory):
The aggregate EM index rose to a five-month high of 51.6. Caixin’s manufacturing PMI for China (included in the EM aggregate) rose by more than a full point to 51.5. Note that China’s alternative index, the ‘official one’ published by NBS, also picked up, but only marginally and is still just above the neutral mark (see our comment on China’s November PMIs ).
Regarding developed markets (DM), the aggregate index rose by 0.3 point to 48.4, still clearly in contraction territory. Amongst DMs, gains in the US (both Markit and ISM) stood out versus more weakness in Europe. The manufacturing PMI for the eurozone dropped back to 45.2 from 46.0 in October, and the UK’s index fell to a nine-month low of 48.0. Within the eurozone, Germany’s index stabilised at a weak level of 43.0, while the index for France and the Netherlands fell to one-year lows (of 43.1 and 46.6, respectively) – see comment on Dutch manufacturing PMI ).
Demand picks up (also driven by EMs), and global excess supply continues
Looking more closely at the global manufacturing PMI’s subindices, there are improvements on both the demand and the supply side. However, these improvements are – on balance – also driven by EMs, while the supply side remains stronger from a global perspective. The global output component rose to 50.4 (October: 50.1), while the domestic orders component returned to expansion territory (albeit marginally, at 50.1) for the first time in five months. The global export orders component rose by 0.3 point to a four-month high of 48.6 (also driven by EMs), but remained clearly in contraction territory. These developments are also still visible in our global supply bottlenecks index, for which an excess supply/demand metric (more specifically: output in EMs versus demand in DMs) is one of the key components. As a result, our global supply bottlenecks index moved a bit further into “excess supply” territory in November.
Subcomponents for input and output prices up, but remain far below 2021/22 peaks
While the ongoing global excess supply conditions help keep a lid on cost push price pressures stemming from global manufacturing, the global PMI component for input and output prices picked up a bit in November. Still, they remain well below the peaks seen during the pandemic episode of abundant supply bottlenecks in 2021-2022, and also below this year’s peak levels seen in June. That said, in case of heavy trade frontloading (regarding US imports), we could see (temporary) pressures on industrial goods’ prices stemming from capacity issues.
An example for this could be container freight tariffs, although so far we do not see an increase of spot container tariffs for containers from Asia or Europe heading to the US. To the contrary, Shanghai-Los Angeles and Shanghai-New York tariffs have continued to come down in recent weeks, while Rotterdam-New York tariffs have been flat since the US elections. That said, Shanghai-Rotterdam tariffs have been on the rise again since October, but that does not seem to be related to trade frontloading.
More broadly, potential disturbances in global supply chains stemming from renewed tariff wars could also lead to industrial goods’ price pressures for some time (at least initially, before the demand effects from the trade tariff start to dominate). In mid-2018, when the US started to implement China tariffs, the global components for input/output prices only showed a brief and modest uptick (not necessarily one-on-one related to these tariffs), but we expect a much bigger and broader tariff shock in 2025.

