ESG - Weak relationship green bonds bank share and real estate portfolio energy performance

Recently, we published a note regarding the energy performance of European covered bonds. In this note we leverage a similar methodology to answer a few additional questions: (1) is there a correlation between the share of banks’ green bonds and the energy performance of their real estate portfolio? And, (2) is the share of proceeds allocated towards real estate improving a banks’ mortgage book energy usage? Our analysis indicates that there is some positive relationship between the share of green bonds and the energy efficiency of banks’ mortgage books, albeit very weak. This is also only the case if we either exclude outliers or focus solely on green covered bonds. Furthermore, we show that the share allocated towards real estate within a green bond does not influence our results. We find similar conclusions when correcting the energy performance of a bank’s portfolio by that of a country’s building stock. But, once again, this is only the case when we correct our sample for outliers. Overall, the relationship between a bank’s share of green bonds and the energy performance of its real estate portfolio is weak.
We recently published a note concerning the energy efficiency of covered bonds (see here). There, we first estimated the average energy performance of each bank’s mortgage loan book, which we thereafter linked to the share of residential versus commercial real estate in each banks’ cover pool. Subsequently, we estimated the average energy performance of the cover pools backing covered bonds.
Using a similar methodology, we now aim to investigate whether there is a relationship between a bank’s share of green bonds over total outstanding bonds and the average energy intensity of its mortgage loan book. The hypothesis being that the more green bonds a bank has, the lower the energy intensity of its mortgage book. This reflects the fact that green bonds’ proceeds need to be allocated towards environmental-friendly projects, such as green buildings. Moreover, we also analyse whether there is a relationship between the energy performance of the bank’s mortgage book and the share of green bond proceeds allocated towards real estate. The idea is that, would banks have less energy efficient real estate portfolios, then they would naturally rely on other assets to allocate their green bonds proceeds.
The note is set out as follows: in the next section, we explain the sample and the methodology employed, as well as the results to the first question. In the following section, we discuss our second research question, and conclude.
Do green bonds support higher energy efficiency of bank’s mortgage books?
We broadened our previous sample to include banks that are not part of the Euro-area. The reason for that is that Norwegian, Swedish, and Danish banks have a large share of green bonds over their outstanding bonds, which makes them an interesting case-study to include in our research. As such, our sample now includes 36 banks, from 12 different European countries: Belgium, Italy, Ireland, Spain, Germany, France, Finland, Austria, Denmark, Norway, the Netherlands and Sweden.
In order to calculate the average energy performance of these banks’ mortgage books as well as their covered bonds, we used the same methodology applied in our previous research, relying both on banks’ Pillar 3 reports and their transparency reports as provided in the Covered Bond Label website (see ).
As a next step, we compare the estimated energy efficiency of the banks’ mortgage books with the share of green bonds over total outstanding bonds. In both cases, we exclude subordinated debt, as these are usually not issued in green format and would be therefore likely skewing our results. That is, we focus exclusively on senior and covered bonds. We feel comfortable to include both asset classes given that the criteria regarding the eligibility of assets applies to both (more on this below). Furthermore, we also focus only on benchmark size bonds (amount outstanding > EUR 500m). Results are presented below.

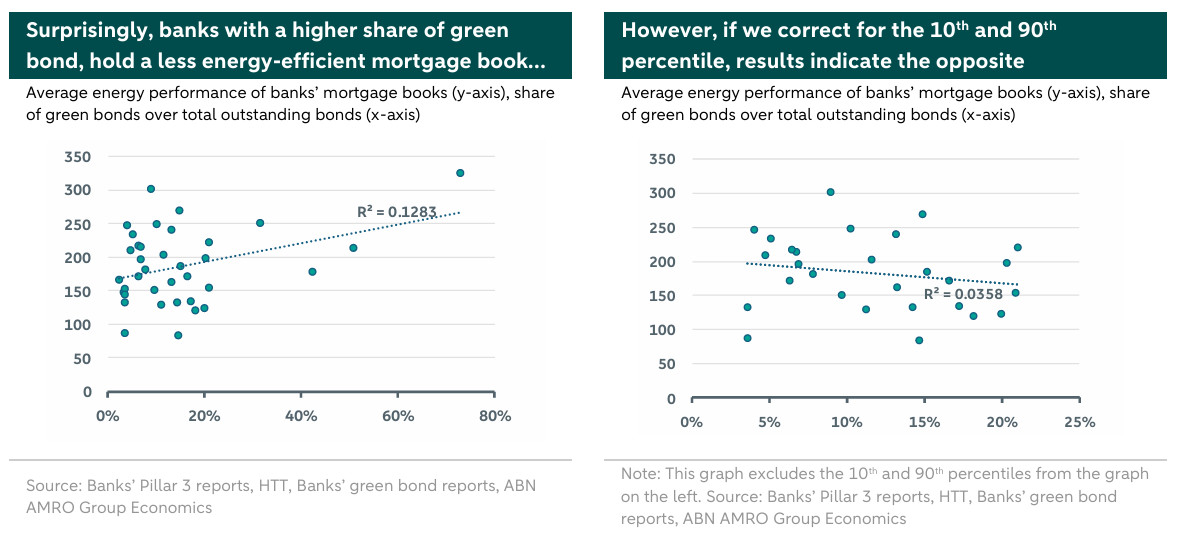
According to the plot on the left, there seems to be a negative relationship between the share of green bonds and the energy efficiency of a bank’s portfolio. That is, the higher the share of green bonds, the less energy efficient the bank’s mortgage portfolio is (i.e., properties have a higher average energy usage). This seems counterintuitive and the opposite of what we would have expected. Nevertheless, we see that the graph contains a few outliers, which might be skewing the results. As such, we aim to correct for that by excluding the 10th and 90th percentiles. The adjusted results are then presented on the chart above on the right. In this new plot, the relationship between the variables is more in line with our expectations in terms of direction. That is, banks with a higher share of green bonds, tend to finance mortgages with a lower energy usage. However, the relationship is very weak, with several banks still performing above or below the trendline. Indeed, the R-squared of 3.6% basically suggests no relationship.
We move then to analyse the relationship between green covered bonds and the total amount of covered bonds outstanding. In this case, as we consider only covered bonds, our sample size slightly decreases, given that not all banks in our sample issue green benchmark covered bonds. Nevertheless, considering 15 issuers, the results are in accordance with our first hypothesis, but only somewhat stronger than our previous ones. Indeed, the relationship is still very weak (as shown by the R-squared of 10%). Still, banks with a higher share of green covered bonds tend to also display a loan book that is more energy-efficient. For instance, Nordea holds a share of 34% of green covered bonds over total covered bonds, and its covered bonds have an estimated energy performance of 157 kWh/m2 (below the sample average of 172 kWh/m2). On the other hand, the Dutch Rabobank holds 2% of green covered bonds, for which we estimate a much higher energy performance of 233 kWh/m2. Although the negative relationship we expected is present here (without the need to correct of outliers), we deem the sample size to be too small to reach strong conclusions.

Do banks with less energy efficient real estate portfolios tend to allocate more green bond proceeds to non-real estate categories?
One reason that could explain why we do not find a strong negative relationship between the energy intensity of a bank’s mortgage book and the amount of green bonds it issues is the fact that not all green bond proceeds are allocated towards real estate. As a next step, we investigate the relationship between the energy performance of the bank’s mortgage book and the share of green bond proceeds allocated towards real estate. After analysing banks’ green bond frameworks, we note that there are two sectors to which banks allocate most proceeds: renewable energy (solar + wind) and real estate. Moreover, in order to qualify as eligible real estate assets, the criteria used often regards the financing or refinancing of new or existing buildings that complies with the following:
(a) buildings with a valid EPC label higher or equal to A;(b) buildings belonging to the top 15% of the national building stock; (c) buildings built after 31 December 2020 with an energy performance at least 10% better than the threshold for Nearly Zero-Energy Buildings (NZEB) in the domestic market; (d) buildings that have been refurbished, resulting in a relative improvement in primary energy demand of at least 30% in comparison to the performance of the building before renovation.
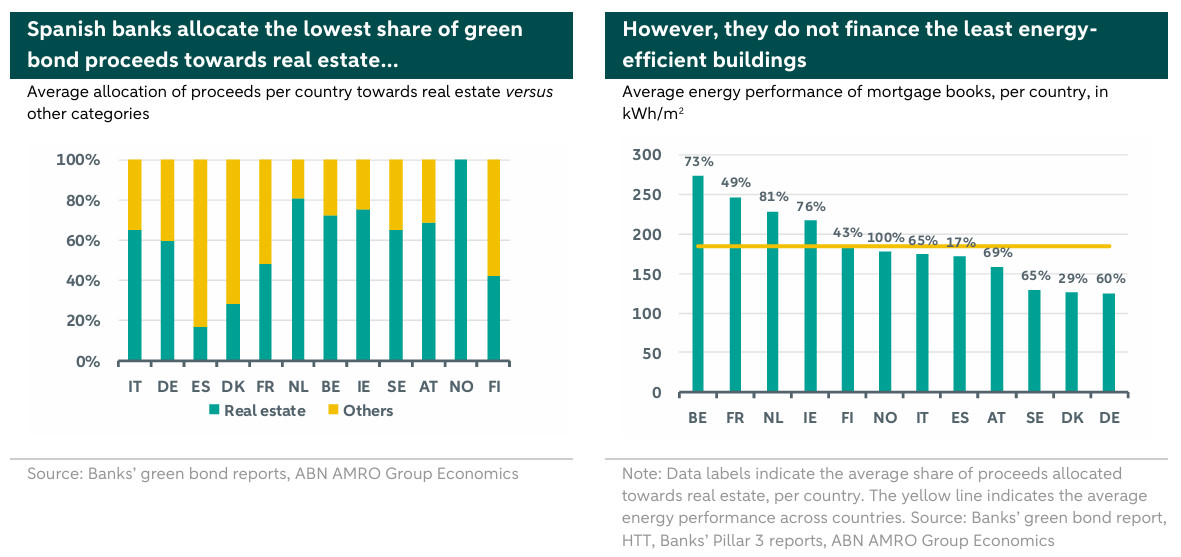
Our analysis indicates that, on average, banks allocate 56% of their green bond proceeds towards real-estate and 44% towards other categories, including renewable energy (see appendix). Some banks even fully allocate the proceeds to only one category. Hence, one could argue that even with a significant share of green bonds, issuers could potentially be allocating proceeds towards these other categories if the energy efficiency of their mortgage book is not high enough. This would allow them to issue green bonds while having a very energy intensive building stock. With that in mind, we plot on the next page the average share of proceeds allocated to real estate by country versus the average energy-use of the mortgage book.
To investigate this, we focus first on an analysis at country level and, as such, plot on the next page the average share of proceeds allocated towards real estate by country versus the average energy-use of the mortgage book.

Our analysis indicates that there does not seem to be a relationship between the share allocated towards real estate and the energy efficiency of the real estate portfolio – at least not on a country level. For example, as we can see from the chart above (right), Spanish banks tend to allocate, on average, only 17% of their green bond proceeds towards real estate. However, the properties they finance have an energy performance better than average. On the other hand, Belgian banks are the ones financing the buildings with the lowest energy performance, despite allocating 73% of their proceeds towards real estate. One reason for this might be related to the energy performance of each country’s building stock.
Indeed, one important remark is that the definition of what a “green” property is might differ per country. The table below shows for four countries the energy usage correspondent to each EPC label. By using as eligibility criteria for green bonds “buildings with an A-label”, banks might be financing properties that significantly differ in terms of their energy usage. That is because the properties that match the A-label in a country might differ significantly from the ones that match the A-label in another. For example, Belgium classifies properties as an A-label that would be classified as a C-label in Germany.

In the case of Belgium, as we mentioned in our previous note, the building stock is the least energy efficient of our sample. As such, the country’s top 15% of the national building stock, which banks are financing through their green bonds, is likely underperforming that of other countries. Belgium classifies properties as an A-label that would be classified as a C-label in Germany. Hence, even though those properties are eligible to be financed by a green bond in Belgium, they might not be “as green” on a comparative basis. Therefore, although spending a considerable amount of green bond proceeds in real estate, Belgian banks’ mortgage books still look quite energy-inefficient. As such, we remain confident that the share allocated towards real estate does not influence our previous results.
This might also help us explain why we do not see a strong relationship between the share of banks’ green bonds and the energy efficiency of their mortgage books and why there are also some outliers. For instance, the Belgian Argenta Spaarbank, despite having a high share of green bonds over total bonds (32%), displays an average energy performance of 250 kWh/m2 for its real estate portfolio, which is considerably higher than the sample’s average of 177 kWh/m2. This proves once again that the results might be biased by a country’s building stock.
Do banks with more energy efficient real estate portfolios (vis-à-vis the national average) tend to issue more green bonds?
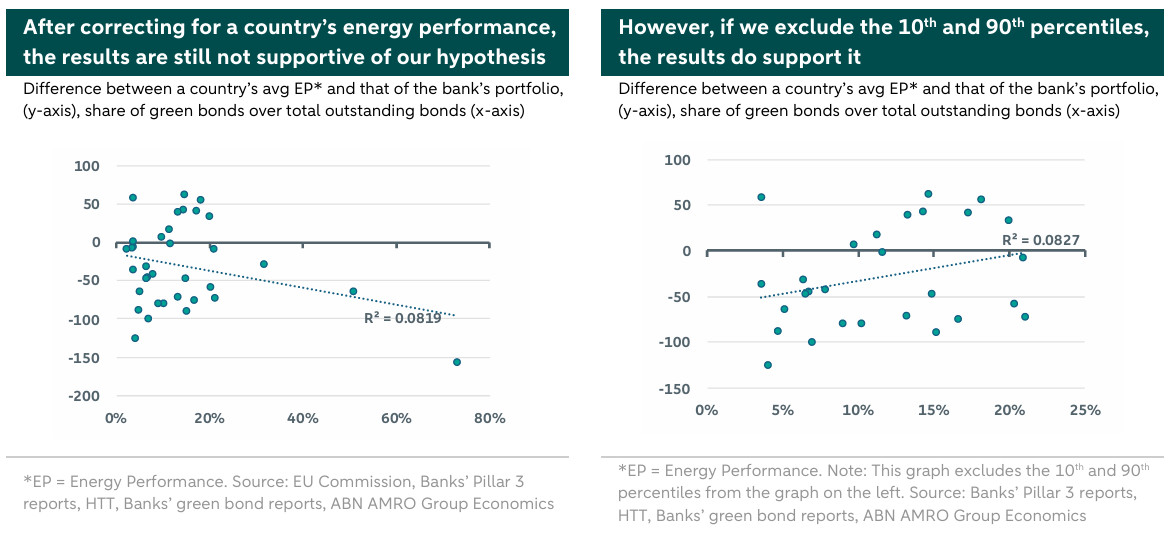
Finally, given the above, we aim to investigate whether there is a relationship between how energy efficient a bank’s mortgage book is vis-à-vis the country’s average and the share of green bonds issued. For the former, we subtract each bank’s average energy performance to the corresponding country’s average. Although some banks have global operations, we focus on the country where the bank is headquartered, assuming this is also where the majority of its operations take place. We expect that if a bank has a better energy performance than that of the country’s, then it might have a higher share of green bonds. Below, we plot the results.

The results on the left-hand graph, again, do not support our hypothesis. According to the graph, banks with an energy usage higher than that of the country’s average (indicated by a negative sign on the y-axis), tend to hold a higher share of green bonds over outstanding bonds. However, we can observe some outliers in this graph, which might be biasing our results. Considering that, the graph on the right excludes the 10th and 90th percentiles. As we can see, the results are now more in line with our hypothesis in terms of direction. That is, banks with a higher share of green bonds, do tend to finance a real estate portfolio that is more energy efficient than the national building stock (as indicated by a positive sign on the y-axis). So the energy usage of the national building stock might be biasing the results in the previous sections. Nevertheless, it is important to note that also here there is a large number of banks that either plot above or below the trendline, suggesting a very weak relationship. That is also evidenced by a R-squared of only 8%.
Conclusion
Overall, there is little evidence of a relationship between a bank’s share of green bonds and the energy-efficiency of its real estate portfolio. This remains the case even when either focusing solely on covered bonds or by correcting for the country’s building stock energy usage. One potential reason for this regards the criteria to select green eligible assets. For instance, one of the criteria that most banks use to define a green building regards the EPC label A. However, an A-label in Germany is quite different from an A-label in Belgium. As a result, while these banks might be eligible to issue a significant share of green bonds, they still have a relatively poor energy performance of their building portfolio.
Our analysis also indicates that there does not seem to be any correlation between the share of green bond proceeds allocated towards real estate and the share of green bonds issued. As such, we reject the hypothesis that banks with more energy intensive mortgages tend to allocate more proceeds to other (non-real estate) categories.
Appendix
Banks’ green bond proceeds allocation, according to their 2023 green bond reports:

