ESG Strategist - ECB expands climate reporting to other monetary portfolios

The ECB’s climate-related financial disclosure reporting no longer focuses only on corporate bonds, and has now been expanded to other asset classes, such as sovereign and covered bonds. With regards to corporate bonds, the higher availability of data also allowed the ECB to make adjustments to its tilting framework methodology. This resulted in the share of issuers with a ‘good’ climate score decreasing, while there was also a slight increase in the share of issuers with a ‘bad’ climate score. Over the years, the corporate bond portfolio shows a steady decarbonization path, although partially driven by inflationary pressures. The ECB claims its tilting strategy remains adequate and delivering the desired results, but admits that “if deviations from the desired trajectory are identified, remedial actions will be assessed”, which opens the door for a potential active reshuffling in the coming year(s). With regards to sovereign bonds, carbon emissions – which have a two-year lag – are compared to the most-recent data on economic activity, which makes meaningful conclusions around these indicators hard. With regards to covered bonds, the ECB relies on issuer-level data, rather than the emissions related to the covered-pool. This may lead to an underestimation of the effect that climate risks can have in the pricing of these instruments. Issuer-level data also excludes financed emissions, which is the primary element in banks' carbon footprint and a key climate risk indicator at the issuer level.
The ECB recently published the second edition of its annual climate-related financial disclosures regarding its asset portfolios held for monetary and non-monetary purposes (see ). While the first publication focused exclusively on corporate sector assets, the ECB expanded its disclosure scope to all other asset classes, including the ECB’s foreign reserves, with the exception of asset-backed securities (ABS), which are still not in scope of the disclosure publication. This means that the ECB’s climate reporting now covers 99.7% of the total assets held for monetary policy purposes under the APP and PEPP portfolios. The expansion of the ECB’s scope of reporting could be an indication that it is also exploring potential ‘greening’ strategies for the other asset classes (now exclusively focused on corporate bonds).
Before digging into preliminary conclusions that can be drawn from the newly-released ECB’s data, we first highlight how the climate indicators are calculated. See below:

For issuers that are not undertakings, such as sovereigns, the metrics related to assets and/or revenues are replaced by the country's production (adjusted by GDP), the total population of the country or government expenditure (see more on this below). From the formulas above we see that:
WACI is a metric that measures the carbon intensity of an issuer (i.e. proportionate to their revenues) relative to the weight that an investment has relative to the total portfolio value. It is given in the form of tCO2/EURm (of revenues).
CF represents the total amount of carbon emissions associated with a portfolio, that is, the amount of emissions generated for every million euros of investment. It is given in the form of tCO2/EURm (of investment).
CI is a measure of the ECB’s share of emissions (that is, proportional to the investment into the company), relative to its share of a company’s revenues. It is given in the form of tCO2/EURm (of revenues).
In this publication, we focus on the disclosures of the Eurosystem’s assets held for monetary purposes, in particular: corporate bonds, covered bonds and sovereign bonds. As such, we exclude the ECB’s foreign reserves portfolios and information related to supranational and agency bonds, which are however also included in the ECB’s newly published report. Below, are the take-aways per asset class.
Insights per asset class
1. Corporate Bonds
Higher share of bonds with poor climate scores due to methodological changes
The ECB introduced a ‘tilting’ framework towards greener issuers – as defined by its own methodology – in October 2022 (see ). The tilting relies on a framework that classifies issuers according to climate scores. Since then, increasing data availability allowed for some improvements to the methodological building blocks of this framework. For example, when assessing the quality of disclosures, the ECB now relies on the percentage of verified emissions. On its forward-looking block, where it assesses the companies’ targets, it now relies on (i) whether the company has set targets that are validated by the Science-Based Targets initiative (SBTi), and (ii) the company’s track record in achieving / adhering to its own emission targets.
Given these reviews in the scoring methodology, the portfolio distribution per climate score has shifted. In the ECB’s previous climate-related disclosure report (published in 2023, see ), around 50% of the corporate bonds held by the Eurosystem had a high ‘climate score’ of either 4 or 5 (based on the old methodology). This share dropped to around 45% now. Also the share of corporate bonds with a poor ‘climate score’ of either 0 or 1 has increased from 10% previously to 17% now. Still, the current portfolio distribution is tilted towards issuers with higher climate scores when compared with the score distribution across the broad market (see chart below). Unfortunately, the comparison with the broad market’s climate score distribution was not available in 2023, which makes it hard to judge whether the tilting from a broad market perspective was more effective over these years. However, overall, we draw the conclusion that the deterioration between 2023 and 2024 is primarily due to methodological changes rather than an underlying weakening of the climate credentials of the issuers.

A steady decarbonization of the corporate portfolio: but was it driven by inflation?
By the end of 2023, 71% of the ECB’s assets were invested in bonds from companies that have an STBi-validated target, reflecting a 12pp increase from the previous year. This figure surpasses the share observed in the broad market, where only 61% of bonds are issued by companies with carbon reduction targets. The overall increase in the number of companies having an SBTi target also reflects the fact that, from 2023 to 2022, the share of companies with science-based targets increased by 102%. Currently, 40% of the 2,300 companies in Europe that have committed to SBTi targets do not yet have those targets validated, indicating that there should be a sharp increase in the share of eligible issuers that hold an SBTi-validated decarbonisation target over the upcoming year(s). This, in turn, positively favours the share of corporate bond issuers receiving a good score under the ‘forward looking’ block.
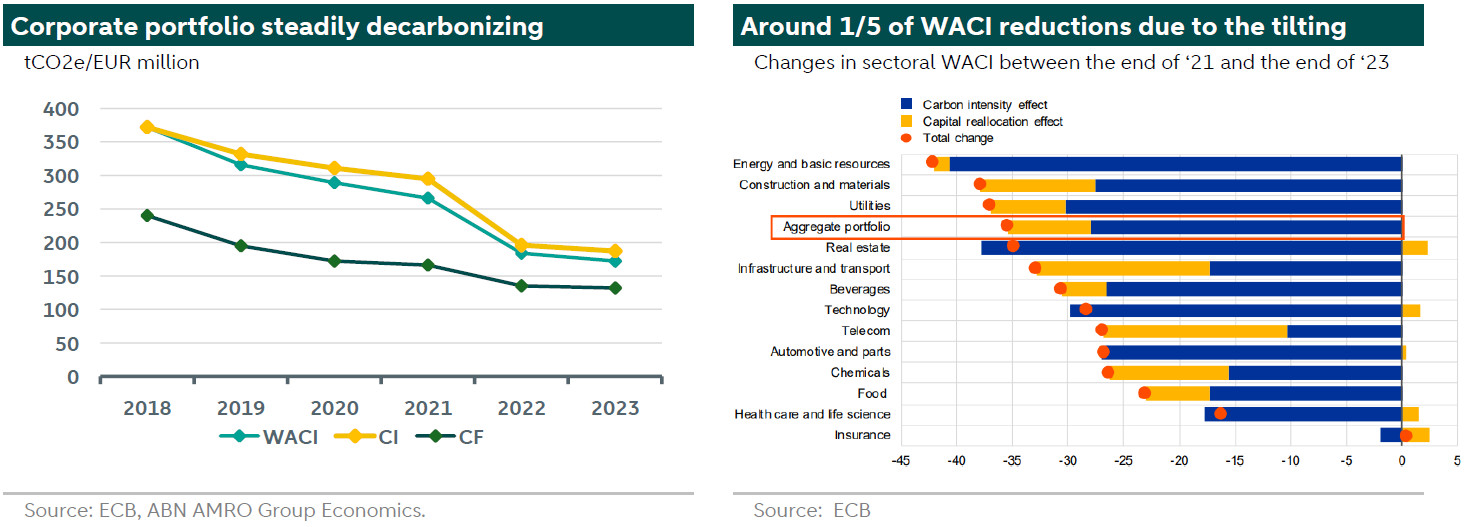
As shown in the chart below (left), the corporate sector securities held under the APP and PEPP portfolios have all experienced a continuous decarbonisation trajectory since 2018. This reduction in carbon emissions (as proxied by the different climate indicators) is more evident from 2021 to 2022, despite the fact that the ECB only introduced a tilting framework for its purchases of corporate securities in October 2022. Hence, as also evidenced by the right-hand chart below, this decarbonisation was mainly driven by companies’ own efforts to reduce emissions. Overall, around 20% of the reduction in WACI was driven by the ECB tilting its corporate sector purchases towards greener issuers.

One note of caution is that the ECB’s indicators do not correct for inflation. Hence, it could be argued (as admitted by the ECB itself) that a big contributor to a reduction in an issuer’s individual emission intensities was due to a rise in inflation, which inflates revenues but maintains the level of carbon emissions constant. For example, the ECB states that “some sectors that make a large contribution to the financed emissions of the corporate sector portfolios (for example, energy and basic resources) benefitted from a significant increase in weighted average revenues of up to 60% year-on-year”. However, at this point there is no methodology available to robustly adjust for the impact of inflation.
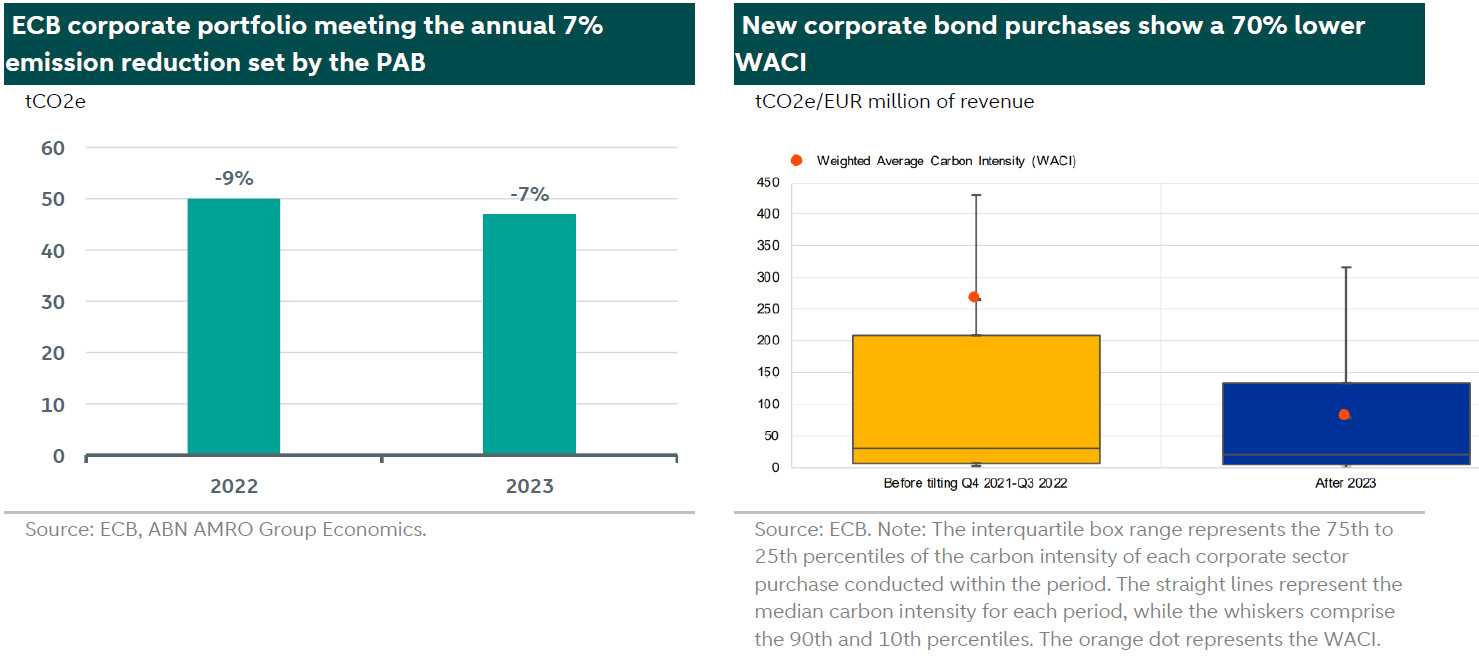
Still, this opens up the question of to what extent will the ECB’s portfolio continue to be on a Paris-aligned pathway, now that we are in a period of disinflation. The ECB claims that currently, its portfolio is aligned with the Paris Agreement. This can indeed be verified by assuming that the central bank’s interim portfolio targets, which are not formally disclosed, rely on the annual emission reduction targets as set out under the EU Benchmarks Regulation (e.g. Paris-aligned Benchmark, or PAB, which is used as guidance by the ECB to set those targets). According to this Regulation, a portfolio is aligned with the IPCC’s 1.5 degree scenario if it achieves a decarbonisation rate of at least 7% per year. The ECB’s corporate portfolio saw a reduction in emissions of 9% and 7% in 2022 and 2023, respectively (see chart on the next page), which would make it aligned with the Paris agreement decarbonisation pathway.
Should we expect a portfolio reshuffling?
Were the corporate bond portfolio no longer be aligned with the Paris agreement, then the ECB will likely consider an active reshuffling. While not being so explicit, the central bank stated that “if deviations from the desired trajectory are identified, remedial actions will be assessed, within our mandate, on a case-by-case basis”. Furthermore, it also mentions that “potential triggers for the corporate sector portfolio (…) will allow the Governing Council to (…) decide on further measures in the event of meaningful deviations” (read our previous piece on this topic here: ESG Strategist - ECB unlikely to reshuffle corporate bond portfolio in 2024).
Hence, once again, with inflation pressures deaccelerating, it seems that the ECB is increasingly relying on issuers’ decarbonisation efforts to be met. It remains therefore to be seen whether an active reshuffling might be on the cards for the upcoming years.
Overall, however, the ECB claims that the “tilting framework remained adequate” and is “delivering the intended results”. This is also exemplified by the fact that it assessed that new purchases had a WACI that was around 70% lower than purchases conducted before the tilting was in place (see chart below on the right).

2. Sovereign Bonds
Meaningful conclusions from climate indicators hard to be drawn given several limitations
The ECB disclosed for the first time carbon-related indicators for the sovereign bonds (including bonds issued by the EU) held under its public sector portfolios. Below we assess the climate performance of these securities over the years using the same indicators (WACI, CI and CF).
When it comes to sovereign bonds, as we previously noted, these climate indicators are calculated in a slightly different way. Mainly, the underlying total emissions are calculated using three different methods: (1) using emissions within a country’s physical borders (production emissions), (2) using emissions related to domestic consumption (consumption emissions), and (3) using emissions related to the government’s institutions (government emissions). Method (1) relies therefore on a country’s total production (adjusted by GDP), while (2) relies on its total population and (3) on government expenditures. Particularly for when considering the production emissions, the ECB also reports the indicators both including and excluding the effects of land use, land-use change and forestry (LULUCF). Given the above, sovereign bond climate indicators should be interpreted separately from the other portfolios. It is worth noting that, differently from the other portfolios, an important limitation for when looking at sovereign bonds climate indicators is the fact that there is a two-year lag in sovereign emission data availability. Due to that, the indicators use a different reference year for nominator and denominator. For example: while the latest emissions data is from 2021, the GDP data is as of 2022.
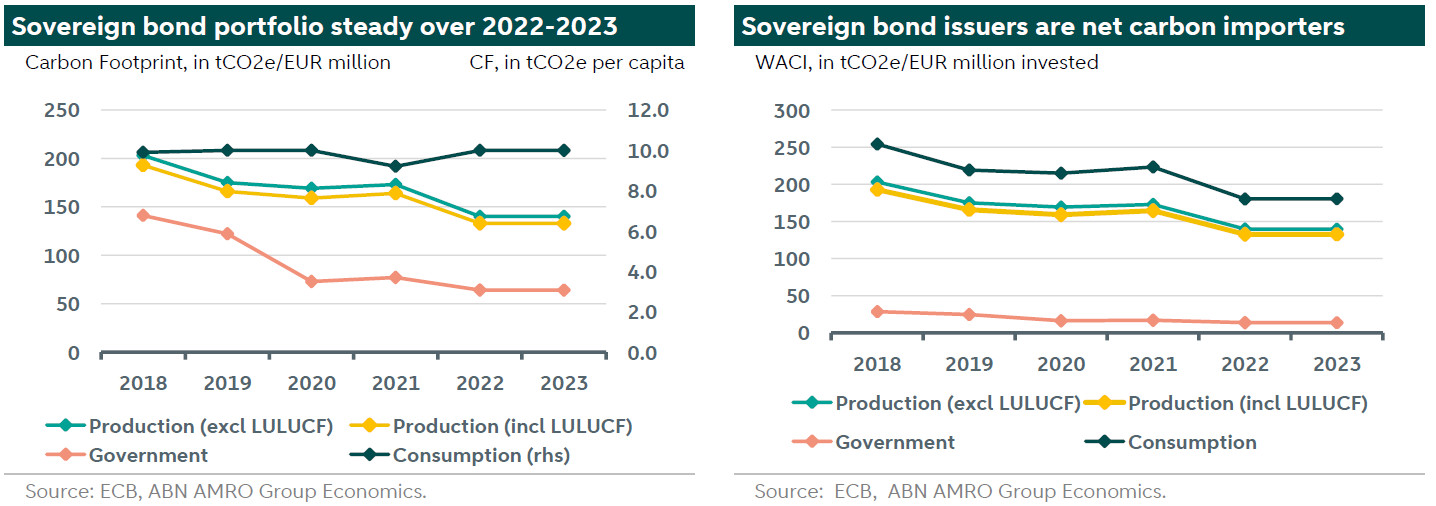
Looking first at the WACI indicator (see chart on the next page on the left), a few interesting things pop-out. Firstly, the WACI across the different metrics (that is, WACI using production, consumption and government emissions) has been very steady over the 2022-2023 period, but reduced significantly over the 2018-2023 period, reaching a decline as much as 55% in case of the WACI for government emissions. The latter was mainly driven by the pandemic, which reduced government direct and indirect emissions from 2019 to 2020. Hence, the ECB admits that “the reduction in emissions visible in the data from 2021 to 2023 is likely overstated, as it is driven by recent macro data that reflect increased economic activity”. This overstatement takes into account the previously mentioned two-year lag period of emission reporting from countries. Given this, we judge it hard to draw any meaningful conclusions from the sovereign bond climate indicators.

Another interesting observation from this data is that the WACI for consumption is higher than the one for production. The same trend is also noticeable when looking at the CF indicator. This indicates that the sovereign bonds held by the ECB are, on aggregate, net carbon importers.
Due to ECB’s capital key, the ECB has limited influence on the decarbonization trajectory related to sovereign bonds. As such, it depends on governments delivering on their decarbonization pledges, making the ECB “call upon governments to deliver on those pledges”.
3. Covered bonds
The ECB reported for the first time the carbon-related indicators for its covered bond portfolio, but these involve a big limitation: they refer to issuer-level data, rather than the underlying assets. More specifically, the indicators cover scope 1 and 2 (direct) emissions of covered bond issuers, given the lack of data availability (and high fragmentation) of cover pool-specific emissions.
Covered bonds issuers are financial institutions, mainly banks. Hence, scope 1 and 2 emissions of banks refer to emissions related to their offices, their electricity consumption as well as heating and cooling. It therefore excludes financed emissions (scope 3), that is – emissions of the bank’s borrowers. That being said, the ECB data as reported at the moment gives only insights into the direct carbon emissions of banks, rather than the underlying assets linked to the covered bond.
The primary objective of the ECB is to maintain price stability in the euro area, targeting an inflation rate of 2% over the medium term. The ECB understands that climate change and transition policies can lead to macroeconomic and financial market disruptions, which would in turn, affect the outlook for price stability. That is therefore the purpose of the ECB when analysing carbon-related data for its portfolios. However, focusing solely on issuer-level data, rather than asset-level data, may lead to an underestimation of the effect that climate risks can have on the pricing of covered bonds. Furthermore, while assessing risks from an issuer-level perspective is also important, the current assessment excludes financed emissions - the primary portion of banks’ carbon footprint and a key climate risk indicator at issuer-level. Recall that, for its collateral framework, the ECB assesses the riskiness of covered bonds (and consequently, the corresponding haircut) based on the assumption that the value of these assets are ring-fenced from its counterparty.
Looking at the disclosed issuer-level data, the WACI of the covered bond portfolio decreased by 62% between 2018 and 2023. Most of the emission reductions took place in 2021, driven by one issuer according to the ECB, which we assume to be Helaba, as this bank experienced a significant decrease in enterprise value that year following concerns about its exposure to the troubled German fintech company Wirecard. A reduction in the value of assets, coupled with relatively stable emissions, drove a reduction in WACI and CI. Also overall negative effects on banks’ enterprise value during disturbances caused by the pandemic could explain the sharp decrease in the climate indicators from 2019 to 2020.
While overall the covered bond portfolio shows a reduction in WACI, CI and CF over 2018-2023, this pace of reduction has decreased over 2022-2023. In fact, there was a slight increase in for example CI from 0.298 to 0.324 tCO2e/EURm from 2022 to 2023, respectively. It is unclear what the driver for this slower pace of decarbonisation was.

ECB’s exposure to green bonds
Besides the data presented above, the ECB also published information regarding the share of green bonds in its portfolios, and how that share deviates from the total market. On the latter, the ECB tries to investigate whether their holdings of green bonds significantly deviates from the share within the total eligible universe. To identify green bonds, the ECB relies on the labelling applied by the International Capital Market Association (ICMA).
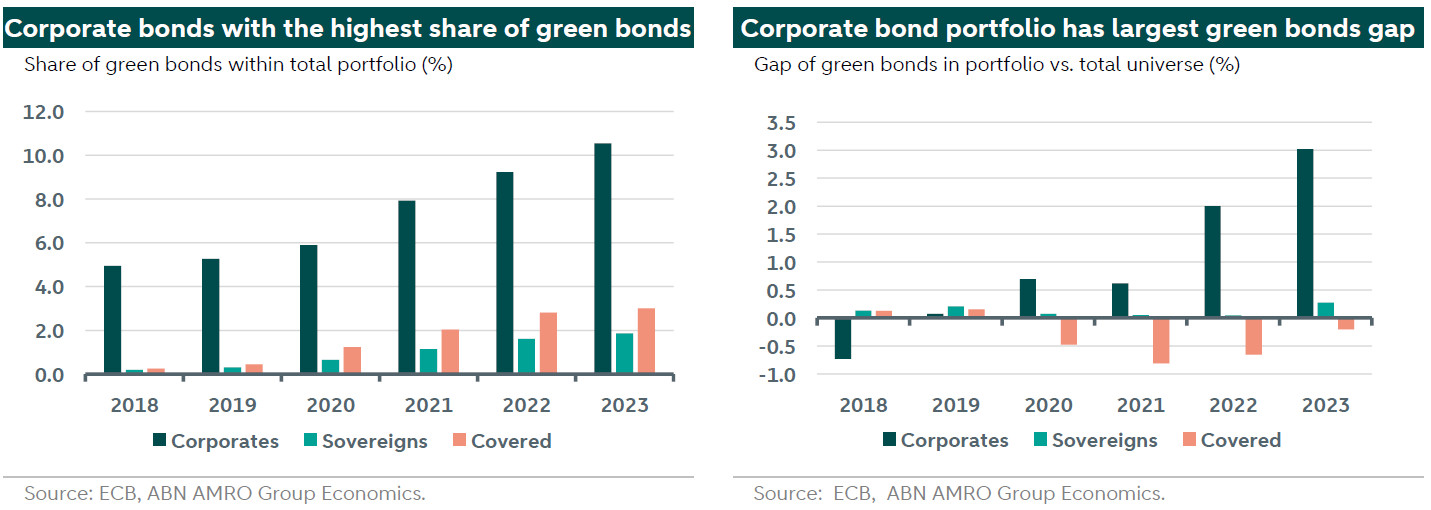
The chart below on the left shows that, within the different asset classes, the corporate portfolio has the highest share of green bonds. This is followed by the covered bond portfolio and lastly, by sovereign bonds. However, as shown in the chart on the right, the corporate bond portfolio also has the largest gap between the share of green bonds within total portfolio and the share of green bonds within the total eligible universe. This is despite the introduction of the tilting in October 2022, which places ‘favorable’ bids for green bonds in the primary market. The main reason attributed to this is the fact that a significant amount of green bonds are issued by utility companies that are government-owned, but the ECB is prohibited from placing primary bids in bonds from such entities. The larger gap is also a result of the limited reinvestments taking place from March 2023, which prevented the ECB from ‘catching up’ with the market.

Looking at covered bonds, we see that this is the only portfolio that has a negative gap (that is – the share of green bonds in the ECB portfolio actually exceeds the share within the total market). This gap however has decreased in 2023, in line with the slightly higher CI and a steady WACI and CF from the covered bond portfolio (as shown in the previous section). With regards to sovereign bonds, albeit small, there has been a positive gap across all years. The ECB attributes this to (i) the fact that they are not allowed to buy sovereign bonds in the primary market, and (ii) the limited liquidity of sovereign green bonds in the secondary market given “a higher share of hold-to-maturity investors and lower outstanding volumes”. This gap gradually decreased after 2020 as green bond issuance (and hence also secondary market liquidity) increased. In 2023, there was another increase due to the limited reinvestments taking place from March 2023.
