ESG - Green bonds exhibit lower volatility and higher liquidity than non-green bonds

Following the first green bond issued in 2007 by the European Investment Bank, the green bond market has evolved to become what is now a USD 5 trillion issuance market. Green bonds offer several benefits for both issuers and investors, leading discussions amongst academics whether these advantages translate into green bonds trading at tighter spread levels (higher prices) compared to non-green bond. This spread difference is called the greenium and is positive if the green bonds trades at tighter spread levels. In this note, we aim to evaluate this topic and explore potential advantages of green bonds for market participants, such as volatility and liquidity. This note is the first of a series of notes about the greenium.
In this note we show that the volatility of euro investment grade green bonds is lower than for non-green bonds across all sectors except utilities. This lower volatility supports the existence of a positive greenium, which is the premium investors are willing to pay for green bonds
We also conclude that green bonds tend to exhibit slightly higher liquidity, based on Bloomberg LQA scores, bid-ask spread relationships and trading volumes relative to outstanding amounts…
…However, the higher liquidity of green bonds isn't consistently observed across all sectors, such as energy, financials and healthcare
Is there a greenium?
There has been many research that discusses the presence and the magnitude of a greenium. That is because estimating the greenium can be a difficult task, mainly because it involves determining a good comparable for the green bond and a significant sample period. In the euro investment grade space, consensus has mostly been that: yes, there is a greenium over time, implying that, overall, green bonds do trade at tighter bond spreads than comparable non-green bonds. This greenium can vary depending on the company’s sector and characteristics. For example, in 2022, the ECB published a report (see ) showing that not only the greenium is present over time but also that a key factor explaining the greenium is the credibility of a green bond itself or that of its issuer.
Are green bonds less volatile?
One way to justify the existence of a greenium is the fact that green bond could provide less volatility, which implies it is an instrument that provides diversification benefits to fixed income investors. This topic was previously explored by us in a note (see ), where we showed that green bond indices are less volatile than conventional (non-green) bond indices, which implies that the Sharpe ratio of these indices (the return per unit of risk) is higher. We further explore this topic by analysing the standard deviation of the z-spread over the last one year for both green and non-green bonds. This is shown in the chart on the next page. As it is possible to see, in all case, except for utilities, the volatility of bond spreads (captured via the standard deviation) is smaller than for non-green bonds. The chart also indicates that non-green bonds by consumer discretionary companies have experienced significant volatility over the last one year, which is likely explained by heightened volatility following a crisis in the European automotive sector.
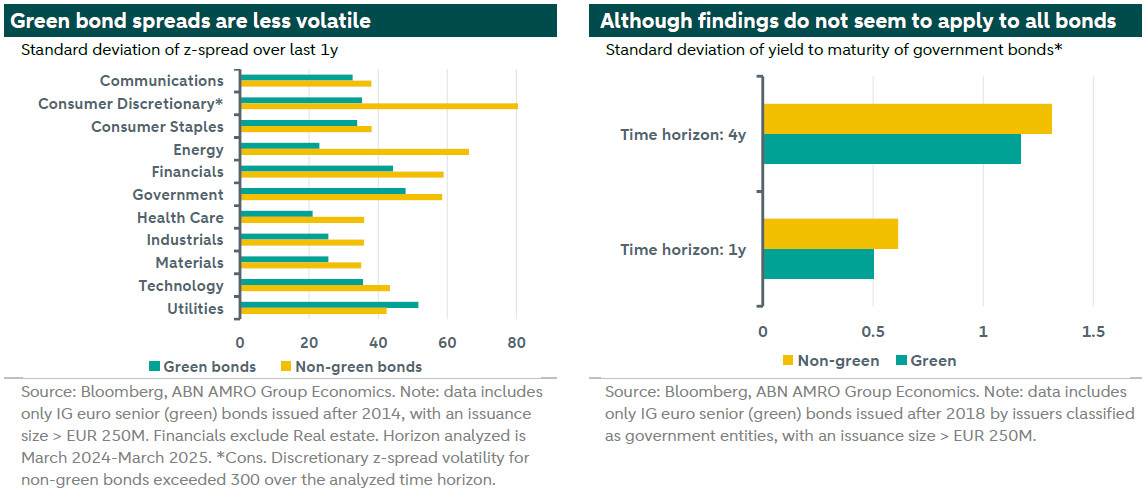
Particularly for government bonds, as the most used pricing indicator is the yield to maturity (YTM) rather than the z-spread, we also evaluate if similar conclusion holds when assessing the volatility of YTMs. And indeed, we do find that government green bonds have a lower volatility (as assessed by YTM) than non-green bonds. This conclusion also holds when increasing the time horizon analyzed from 1 year to 4 years. As such, we argue that overall, green bond spreads experience less volatility than similar non-green bonds.
Are green bonds more liquid?
Another aspect when discussing the greenium is the liquidity of green bonds. That is, if the liquidity is higher, that could help justify the lower spreads (higher prices) of green bonds. We explore the liquidity issue through two variables: by analyzing the average Bloomberg LQA Liquidity Score and the average bid-ask spread over the last one year for green and non-green bonds.
The Bloomberg LQA Liquidity Score is a 1-100 percentile ranking of the estimated liquidation cost for a single security versus other securities in the same asset class. The liquidation cost is calculated for a given volume and time, as such that the score captures the relationship between volume, cost and time. The higher the score, the higher the liquidity (for example, US Treasuries will have a score of 100). We analyzed the average LQA Liquidity Score per sector and the results are presented in the left chart below.
As can be seen in the chart, the LQA Liquidity Score is higher for green bonds for all but the following sectors: Energy, Technology and Utilities. For Energy and Technology, the lower average score could be explained by the fact that there are not many green bonds outstanding by companies from these sectors (for example: for energy: only 14 green bonds vs a non-green bond universe of 162 bonds). This, combined with the fact that usually green bonds by energy and technology companies are associated with heightened greenwashing concerns, could help explain the lower liquidity. A similar rational is applicable for the technology sector.
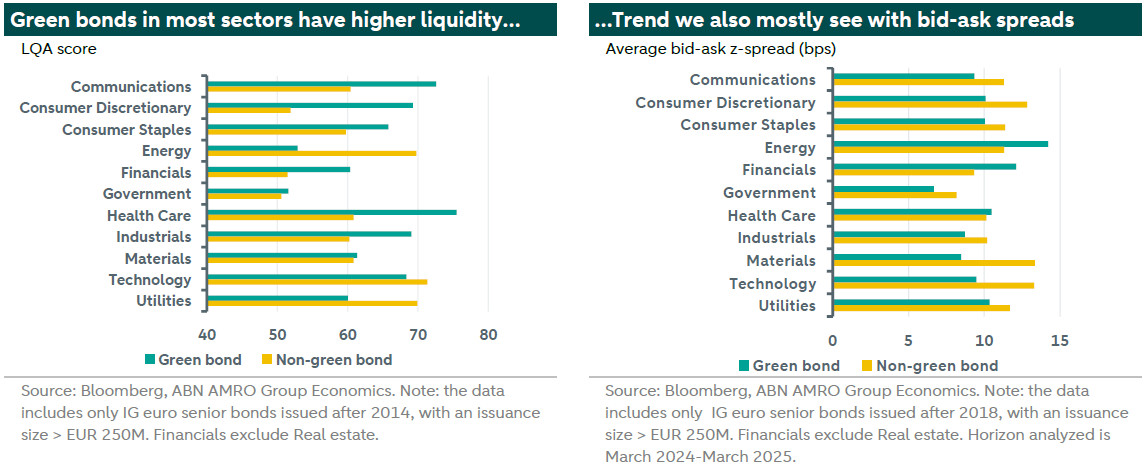
We also analyzed the bid-ask spread over the last one year for green and non-green bonds. A higher bid-ask spread usually indicates lower liquidity. Using this variable to proxy for liquidity we get to similar results. As shown in the chart above (right), within most of the sectors, the bid-ask spread for green bonds is lower (i.e. higher liquidity) than for non-green bonds. The exceptions are within Energy, Financials and Healthcare, which are all sectors where we see that green bonds have a higher bid-ask spread, indicating that green bonds of these sectors trade with lower liquidity than their non-green counterparty.
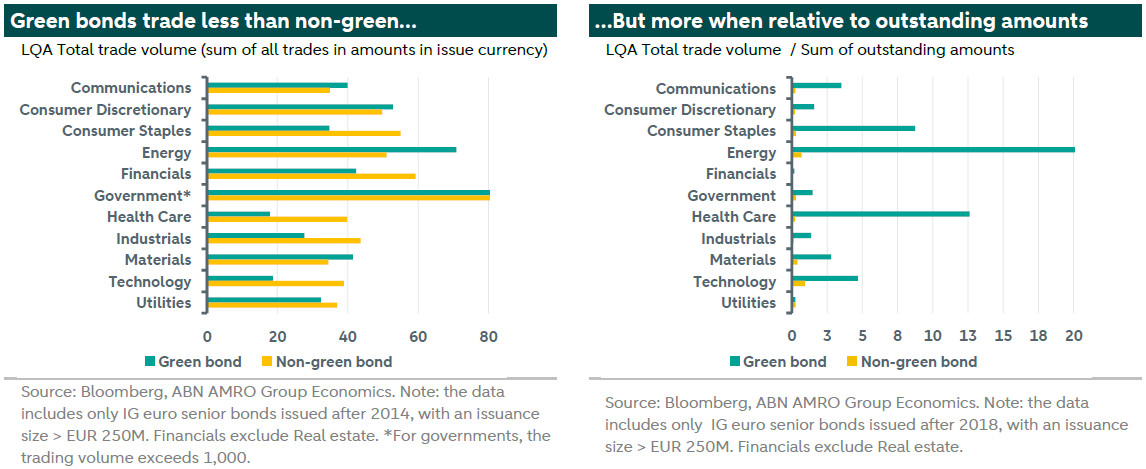
To further investigate this matter, we look at the trading volume of green and non-green bonds over the last month. And indeed, we do see that for some of the aforementioned sectors (including Financials and Healthcare), the volume of green bonds traded is lower than for non-green bonds, which helps to explain the higher bid-ask spread of green bonds (see left graph below). However, once we compare the trading volume relative to the amount of bonds outstanding, we see that green bonds across all sectors - with the exception of utilities - have a higher relative trading volume (see right graph below). That indicates that the lower absolute trading volume of green bonds is solely due to the fact that there are less green bonds outstanding, and that when we correct for this, green bonds actually seem to trade more than non-green ones. As such, the higher bid-ask spread for green bonds of some sectors seems to be attributed to factors beyond mere trading activity.
Overall, we argue that liquidity is higher for green bonds, a conclusion we reach by analyzing mainly the LQA scores and the trading volumes relative to outstanding amounts. We also find evidence that green bonds trade with lower bid-ask spreads than non-green bonds, although this finding is not applicable to all sectors. The higher liquidity of green bonds may come as a surprise given the “buy and hold” nature of some dedicated ESG fixed income funds. However, an conducted late last year with European ESG investors indicates that only a minority of 4% of ESG funds hold a passive “buy and hold” strategy. The 72% of respondents that have an active ESG fund also indicated frequent trading based on either ESG considerations or investment return targets.
The higher liquidity of green bonds could help explain the presence of a greenium over a long time horizon. Our findings are aligned with general academic research (for example show that “green bonds have higher yields, lower variance, and are more liquid”). However, we acknowledge that this remains an ample debate amongst academics.
Conclusion
Quantifying the magnitude greenium remains a difficult challenge given the divergences in bond characteristics across green and non-green pairs, although general consensus is that there is a greenium over a large time horizon. The presence of a greenium can justified by green bonds’ lower volatility and higher liquidity. The lower volatility implies lower risk, which could justify the higher prices of these assets. . Interestingly, however, this conclusion is less compelling in the utilities sector. Furthermore, investors could be willing to pay these higher prices if green bonds provide them with additional liquidity where green bonds have lower trading volumes relative to their outstanding amounts and exhibit higher spread volatility compared to non-green bonds. Also here, we find less convincing evidence for bonds of the energy sector.