US Elections – Spiraling debt is base case

The US debt-to-GDP ratio is on an explosive trajectory, fueled by healthcare and interest expenditures. Neither candidate has proposed policies sufficient to stabilize the ratio. With the exception of debt ceiling negotiations, the impact of large deficits will not be felt during this presidential term.
This is the second piece in a trilogy of weekly election pieces until the presidential election in November where we look at the impact of the candidates’ proposals beyond the headline macro-figures. In the we discussed the extent to which the candidates plan to respect existing institutions, such as the Fed, and the three branches of government. In the final piece we will look at the candidates’ plans regarding financial regulation. In this second piece, we take a deep-dive into US debt, its long-term drivers, and the impact the candidates’ plans have on its trajectory. We also discuss the potential ramifications of the projected rise in federal debt.
Understanding US debt

In order to understand the expected developments in US federal debt, let’s start by focusing on the right definition. Total federal debt of the US consists of debt held by the public and intragovernmental debt. Intragovernmental debt are treasury securities held by federal government accounts, for example the social security and medicare trust funds we will discuss later. Debt held by the public includes treasuries held by the private sector and foreign governments and is the better measure of the effect on the economy. As of 2024 Q2, total debt to GDP stands at 120.0%, while debt held by the public to GDP stands at 95.2%. First consider expected developments in the absence of any changes in policy. Debt evolves due to the accumulation of budget deficits (or surpluses). The budget deficit is the difference between revenues, predominantly from income, payroll and corporate taxes, and outlays, some of which are mandatory, like social security and the health care programs, while others are discretionary. The final important outlay is net interest on the stock of debt, which is greatly influenced by changing interest rates. There has been considerable variability in both the revenue and spending side of things. Whereas the revenue variability has mostly been driven by discretionary changes in the tax code, variability in outlays was mostly driven by mandatory spending, due to exogeneous events such as the great financial crisis and covid.
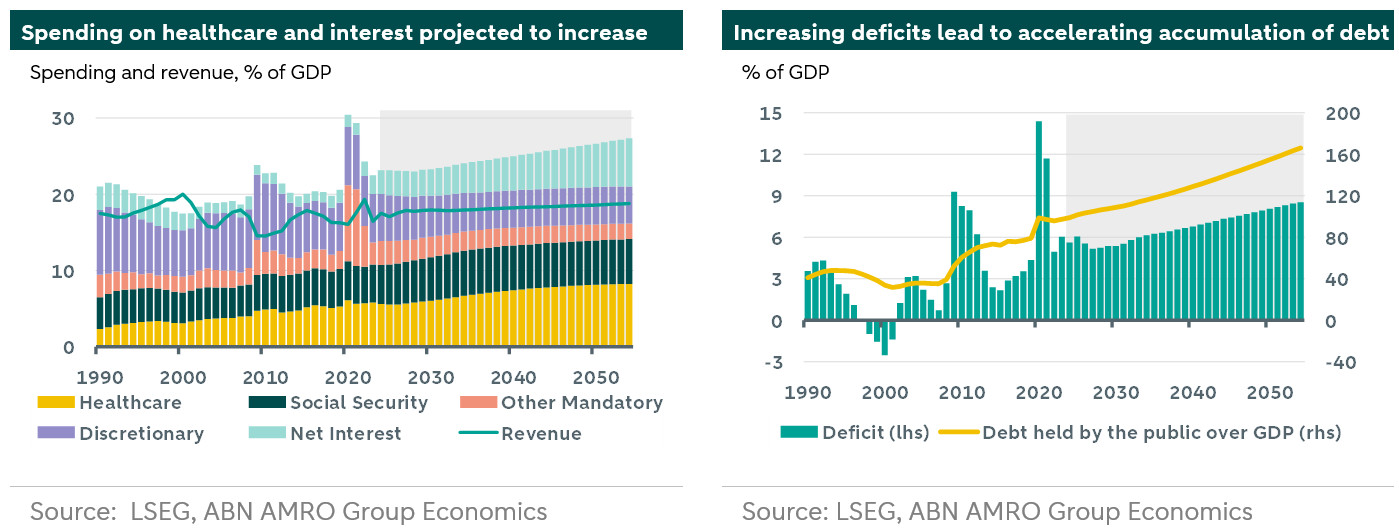
The congressional budget office (CBO) makes detailed projections of the deficit and debt level up to thirty years into the future. The lhs chart above shows a decomposition of actual and forecasted outflows, as well as projected revenue as a percentage of GDP, which importantly accounts for the anticipated expiration of the ‘Trump tax cuts’ (TCJA). Two things stand out. First, the cost of healthcare (medicare and medicaid) is expected to increase from 5.6% to 8.3% of GDP over the course of the next thirty years. This is partly due to the fact that trust funds that were set up to supplement medicare and social security costs will be depleted in the early 2030s, but predominantly fueled by changing demographics. The second is that net interest payments increase drastically, which is due to persistent and increasing deficits. Net interest payments stood at 1.9% of GDP in 2022. Through a combination of the Fed raising rates and a further accumulation of debt, government interest payments are projected to increase to 3.1% of GDP in 2024. This level of interest payments will gradually build, as the cycle of ever increasing interest payments and healthcare outlays lead to higher deficits, increasing levels of debt, putting further pressure on interest payments. Higher debt may lead markets to demand a higher risk premium, which may amplify the interest rate burden and deficit. The US’s debt is therefore projected to be on a path of exponential growth, reaching a debt-to-GDP ratio of 166% by 2054 with no sign of slowing down. By then, interest payments are 6.3% of GDP, accounting for three-quarters of the total deficit. With annual deficits in excess of 6% of GDP, there is also little scope for policies that encourage growth to stabilize the debt-to-GDP ratio.
Between Scylla and Charybdis
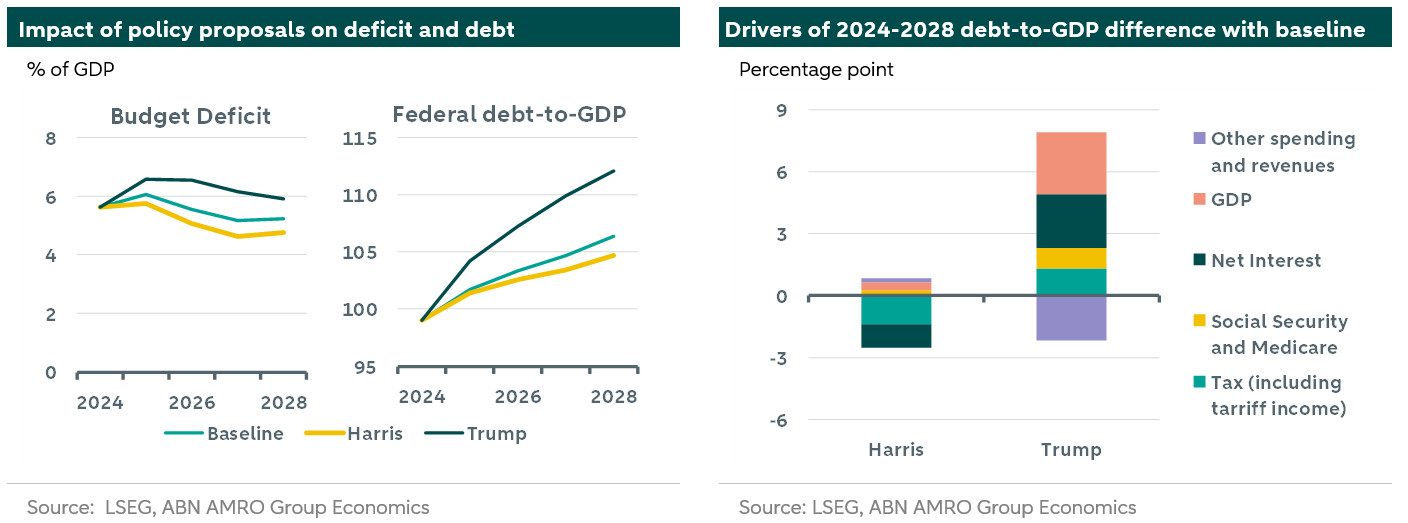
We evaluate the impact of Harris and Trump’s proposals on the budget deficit and debt-to-GDP ratio. The lhs chart below shows that, compared to the baseline, we expect Trump to run greater deficits, and Harris smaller deficits, over the next four years. There is a notable difference in the mechanics, as the rhs chart highlights. Harris makes some efforts to try and stabilize the budget, by tweaking the revenue side, increasing income, wealth and corporate taxes. At the same time, she plans to spend a bit more, but the overall impact is a reduction in the deficit, and a slower accumulation of debt, reaching 105 rather than 106% of GDP by 2028, broadly within the uncertainty of the projection. If the higher level of revenue could be maintained, the long-term trajectory is potentially more benign, but the efforts to balance the budget are insufficient to catch the expected growth in health care costs.

Trump’s higher deficit is a combination of lower revenue, and a second order effect, in the sense that when a trade war erupts on the back of his tariff plans. Since the figures are expressed as a ratio to GDP, a lower level of GDP will inflate the debt figures, accounting for 3 percentage point of the faster accumulation of federal debt to 112% by 2028. Without the GDP effect, the stock of debt is still 3% higher compared to the CBO’s baseline. A second component comes from interest payments as the reignition of inflation due to the import tariffs leads to higher-for-longer interest rates. Third, decreased net immigration puts a strain on net social security and medicare outlays, as the predominantly younger demographic of immigrants usually provides a net positive effect on the budget in the first years after entering the country. These deficit-increasing aspects are balanced by a decrease in discretionary spending through for instance cutting climate-related spending in the IRA. Discretionary climate-related spending now, may however reduce mandatory spending in the future. On a more positive note, Trump has ‘a concept of a plan’ to address the long-term driving force of debt-accumulation, medical outlays.
Jointly, the two candidates are therefore at least talking about the right issues. Containing US debt is a combination of increasing revenues and reducing healthcare outlays. The tax burden on labor in the US stood at 29.9% as of 2024 according to the OECD, almost 5 percentage points below the OECD average. Corporate income tax as a share of GDP stands at 1.6% in the US, half of the OECD average. While unpopular, it is clear that there is scope for raising revenue. At the same time, the fact that there is the potential to raise revenue and significantly decrease the deficit might preclude markets from punishing higher levels of debt. On the costs side, US healthcare spending per capita is over twice the OECD average (as of 2022) according to OECD data, despite worse healthcare outcomes compared to most OECD countries. Understanding the drivers of higher healthcare costs is non-trivial, but prices for prescription drugs often exceed double the prices paid in other OECD countries, and the fact that administrative costs are even five times the OECD average is certainly an indication that there are some inefficiencies with scope for cost reduction.
What would happen if debt levels rise too much?
In the near-term, rising debt levels will mostly come up in relation to the debt ceiling, which has been temporarily suspended by the Fiscal Responsibility Act of 2023, but will be reinstated on January 1 2025. The debt ceiling puts a limit on the ability to pay the obligations the government incurs through its budget (deficit). Over the past thirty years, the debt ceiling has been heavily politicized, grinding the government to a halt while parties try to push through demands in order for them to approve raising the ceiling. Given the debt’s trajectory, this will remain a frequent affair. This demonstrates how higher debt may lead to policy constraints, as high levels of debt make it more difficult to borrow in times of crisis, such as recessions, wars or pandemics. This may limit the government’s ability to stabilize the economy when shocks hit.
In the longer term, rising debt levels, and questions about sustainability of the debt, potentially combined with discussions about the debt ceiling, may force markets to require higher risk premia, raising the interest burden further. This is exemplified by last year’s downgrade of long-term US debt credit rating by Fitch, where it has remained since. Over the past decade or so, other rating agencies have at times downgraded US debt, or put it on the watchlist, often based on debt ceiling discussions. The higher yields on US government debt, along with its abundance, may also keep capital away from profitable investments, hampering growth.
Finally, there is often talk that the high level of debt may threaten the dollar’s status as ‘reserve currency of the world’. The dollar is the most widely held currency as foreign exchange reserve by central banks across the world, and the most widely used currency for trade and international transactions. This has given the US an ‘exorbitant privilege,’ that has mostly faded as the US’s share in the global economy declined. The dollar is unlikely to lose its status, predominantly because there is no viable alternative. The dollar currently accounts for 58% of total reserves, with the euro coming in second at slightly less than 20%. China is trying to increase the renminbi’s influence, by increasing trade and investment with geopolitically aligned countries and invoicing in its currency, but it still stands at only 2% of foreign reserves. If the dollar’s status should be threatened, it will be a slow process. So, while debt sustainability is clearly an issue for the US, ramifications in the medium term will be limited.
Bottom line, the federal government will likely keep on running significant deficits, not due to exorbitant spending programs, but due to rising healthcare outlays and interest payments on the back of higher levels of debt. This debt spiral could be averted by making efforts on both the revenue and outlay side. Harris’ tax plans improve the picture, but do not stabilize the debt-to-GDP ratio. Trump’s plans, and in particular the tariffs, exacerbate the problem, even without the impact on GDP growth. Ultimately, healthcare spending will have to be curbed.

