Housing market - building according to need

The housing shortage is mainly caused by demographic change and less by population growth. The share of single-person households is increasing while we continue to build large homes. This leads to a shortage of smaller and affordable housing, especially in rural areas. Working from home could lead to less pressure in urban, but more in rural areas. Retiring baby boomers may cause a wave of relocations, making the problem worse.

Mike Langen
Senior Economist Housing Market
We need more houses, but debates hinder actions. The Dutch housing market remains tense. Prices are at record highs and continue to rise, while the housing shortage increases. This causes much discontent and public debate. The solution is simple; we need to build more homes. However, building is not an easy task. The Netherlands is a small country and densely populated, so it is difficult to find suitable places. Besides more housing, we also want to protect our nature, don’t cut back on agricultural land, and not overbuild in our neighbourhoods. New construction projects are often thwarted by conflicting interests of different groups, with the result that new projects take an average of 8 to 12 years from start to key handover. And so the housing shortage is only getting worse, probably reaching 400,000 homes very soon.
Everyone will feel the effects of the housing shortage. Although especially people without (suitable) housing are affected by the shortage, everyone will feel the consequences because affordable housing is the base for productivity and a functioning society. It ranges from grown-up children who still have to live with their parents, potentially being an unpleasant situation for both. Maybe they need a car to get to work, meaning families suddenly need more parking space. However, it could also mean that people forgo lower-paying jobs in expensive areas because their wages would not adequately cover the housing costs. As a result, employers will have more trouble attracting talent at the . This is especially problematic for the public sector if there are suddenly fewer bus drivers, teachers, or police officers.
Housing supply is often not adapted to the demand. For many construction projects government requirements and financial calculations determine the type of housing supply. Because of the government quota that , new construction projects must usually meet this requirement. However at current cost levels, these homes are usually not profitable, meaning developers must generate their profit from the last third. This usually means building larger and/or more luxurious homes arguing that there is also demand for these type of homes and that relocation chains will create supply somewhere else. The change in (expected) demand is often of secondary importance. On the one hand it is obviously difficult to predict demand for the coming years. On the other hand do we have a seller’s market, meaning buyers can be less picky. As a result the distribution of housing supply has hardly changed over the past 20 years in terms of property types and size.
There are plenty of homes available, except from the right ones
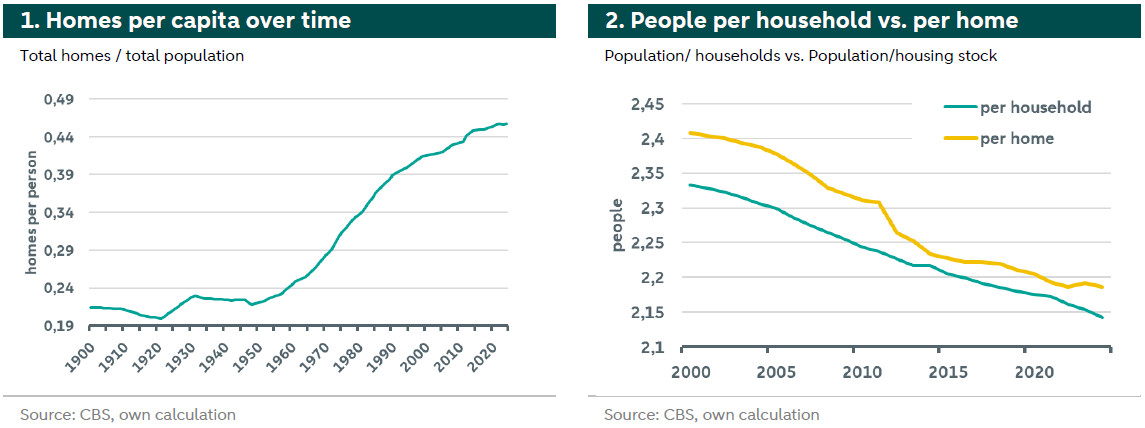
The number of homes is growing faster than the population, but people are using more living space. A closer look at the housing shortage reveals that the biggest problem is not quantity, but the type of housing demanded. Most people want to live larger than it used to be the norm. In fact, the number of homes per capita has never been higher than today. The Netherlands reached 18 million residents by August 2024, with a stock of about 8.2 million homes. This is about 0.45 homes per person. To put that in historical perspective: In 1950, when Queen Juliana said the Netherlands was “full”, there were about 10 million residents and 2.2 million homes, meaning 0.2 homes per person. As shown in Figure 1, the housing stock has been growing faster than the population for almost every year in the last 120 years, increasing the number of homes per inhabitant every year.[1] In other words, 2.19 persons share a home today on average, whereas it was 5 persons in 1950. However, although there are more and more homes per person, the shortage is only getting worse.
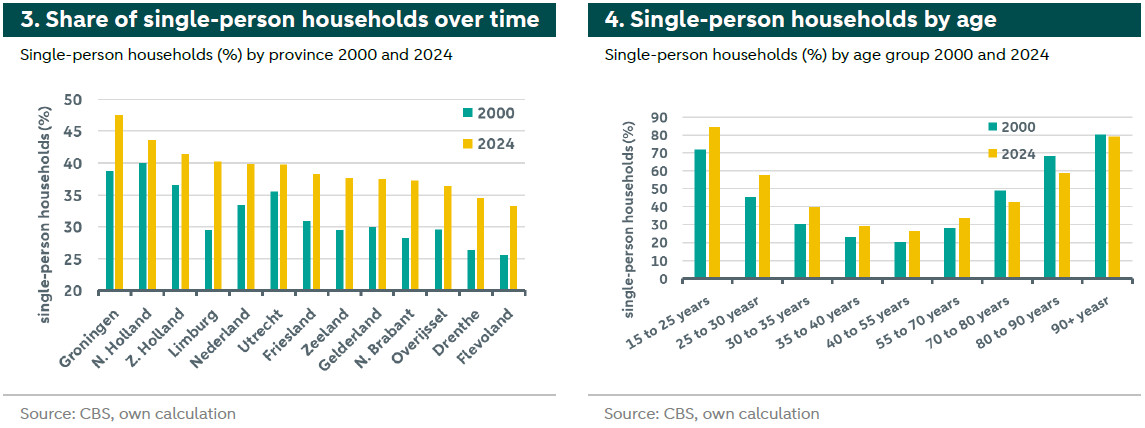
Households are getting smaller at a faster rate than we add suitable housing. The problem is that households are getting smaller, faster than we add suitable housing. This increases the required space per person and the required number of homes per person. Figure 2 shows the average number of persons per household (CBS) and the average number of persons per home. Although there is a parallel trend, the gap between the two remains. On average, a Dutch household today consists of 2.14 persons, but with the available homes ca. 2.19 persons have to share a home. This seems like a small gap, but at 8.37 million households, it leads to a shortage of about 370,000 homes. The biggest is the increasing number of single-person households. As shown in Figure 3, around 40 percent of all Dutch households are now single-person households.
Single-person households are growing mostly in rural areas. We see in Figure 3 that the share of single-person households was always high in urban areas, but it is now also growing in rural areas. In provinces such as Limburg and Drenthe, the share of single-person households has increased by about 30% since the year 2000. Figure 4 shows the share of single-person households by age.[2] Especially young and old households are often single-person households. About 84% of households up to age 25 are single-person households.[3] In absolute terms, taking into account the number of households per age group, households in the age groups 25-30 years (18.2%), 30-35 years (14.6%) and 55-70 years (13.3%) make up the largest share of all single-person households in the Netherlands. Single-person households are thus not only young or old people, but can be found in every age group.
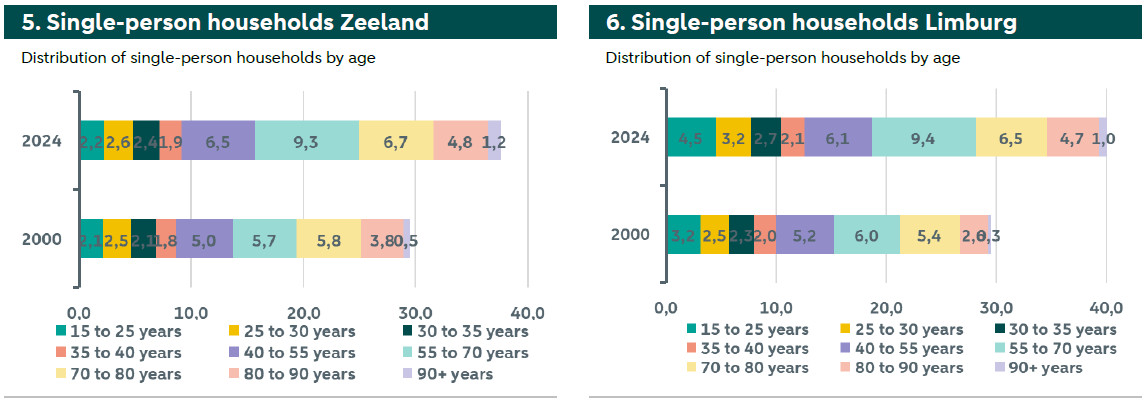
Regional differences require individual analyses. Drawing simple conclusions about demographic change is difficult because trends also vary by region. To illustrate this point, let's take the provinces of Zeeland and Limburg, for example. Both are rural provinces with similar growth rates of single-person households. Figure 5 and 6 show the composition of single-person households by age group over the years. In Zeeland, the growth of single-person households is mainly caused by the 40 to 80 years group, a typical aging pattern. Most single-person households are in the baby boom generation. In Limburg we see a similar trend, but we also see that the number of single-person households is increasing among younger age groups, a sign of population growth. It is important to distinguish the composition because the demand for single-person housing varies by age group, meaning we need to assess regional housing demand individually.
The core problem is the lack of adequate housing supply
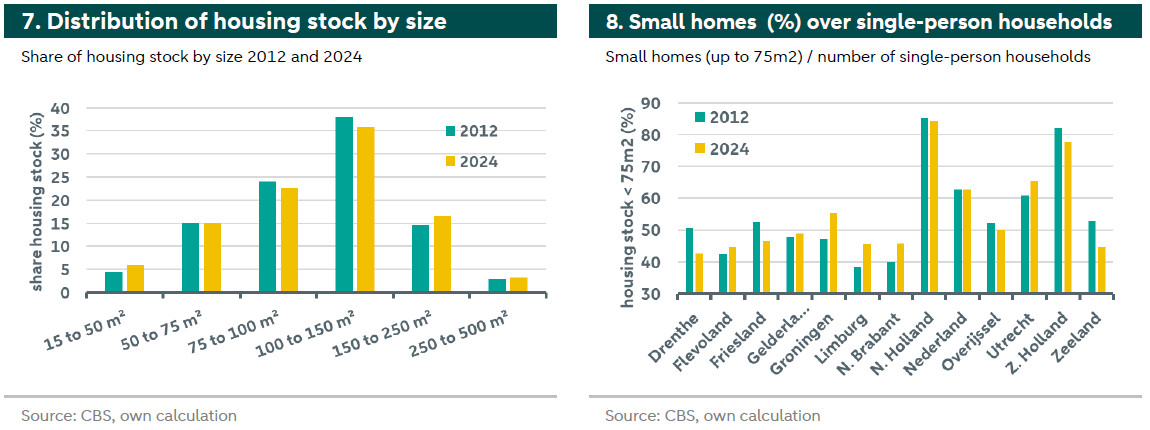
The housing supply has barely adjusted towards more small homes. The share of single-person households grows increasing the need for more small and affordable homes, especially in rural areas where growth is the highest. Since single-person households have only one income their financial constraints are limited. However, looking at supply we see hardly any changes in the distribution of housing by size. Figure 7 shows the share of homes by size. Over time, the share of homes between 75 - 150m2 became slightly smaller. A small share went towards more small homes of 15 - 50m2. However, an equally large share went to larger homes of 150 - 250m2. It is important to note that not only the number of small and large homes increased, but small homes are also built smaller, while large homes are built larger. Overall, the distribution of small and large homes has hardly changed over the past 13 years. Given rising prices per m2 and scarce land, this is counterproductive to creating more affordable housing.
There are too few small homes, especially in rural areas. We illustrate the (mis)match between demand and supply by comparing the housing stock to the number of single-person households. We only look at houses up to 75m2, since we assume that these are affordable for single-person households. This is based on the average living space per person in the Netherlands of about 50m2, whereas we assume slightly more for single-person homes. Furthermore, we consider one modal income with a theoretical borrowing capacity under perfect circumstances (no debts plus some savings). For the demand we only consider single-person households between the ages of 25 and 85 years.[4] Figure 8 shows the ratio between the number of homes in this segment and the number of single-person households. A value of 100 indicates that there is theoretically one suitable home for each household, according to our definitions. Anything below 100 indicates a housing shortage and everything above 100 indicates oversupply. We see that there is a shortage of suitable housing everywhere in the Netherlands. In the Randstad provinces, the shortages is the smallest and there is a suitable supply for about 82% of single-person households. In rural areas the shortage is the greatest, with some regions only having a suitable housing stock for 44-45% of demand.
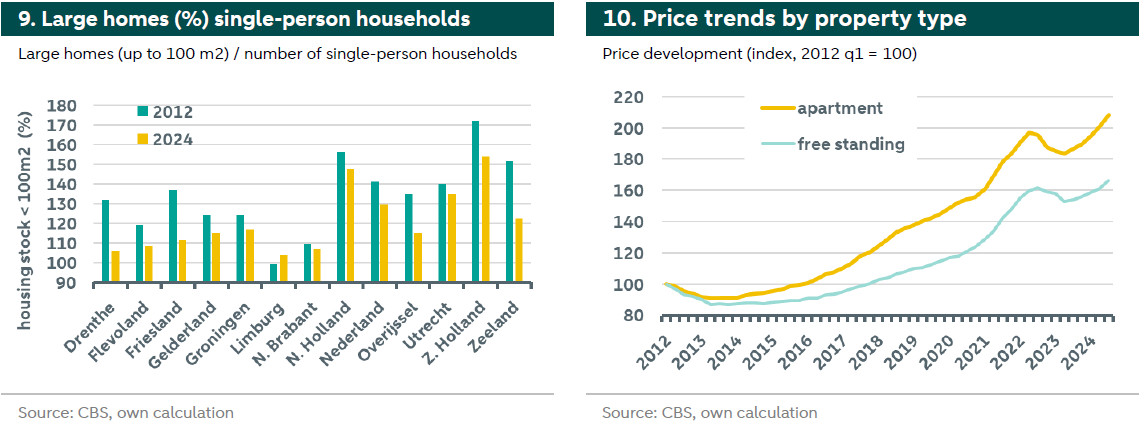
The trend also looks critical for larger homes. It could be that single-person households in rural areas on average occupy more space due to lower land prices. Therefore, we also test a cut-off of 100m2 to define suitable homes. Figure 9 shows the results, indicating a ratio above 100 in all provinces and suggesting sufficient supply. However, there are a few important considerations. First, we see the ratio is falling almost everywhere over time, meaning demand is rising faster than supply. Second, many provinces show a value just above 100, which is problematic because we assumes perfect sorting. In practice, the suitable supply may be occupied by other, multi-person households for example. As a result we assume that the actual ratio is slightly lower than the theoretical value, meaning that there is still a shortage. Finally, 100m2 is almost everywhere twice the affordable housing size based on and current prices per m2.
There is little hope that supply will adjust in the short term. Although the government is ambitious to build new homes, the historic performance is not encouraging. So far, the target of 100,000 new homes per year has never been met. Therefore, the housing shortage is growing every year. We expect that the shortage of small homes will only increase for the following reasons: Long construction cycles and labour shortages mean that most housing projects cannot be completed in the short-term. Most projects further follow the old supply pattern, which means that the proportion of small homes is relatively small. Large homes are generally more profitable to build and There is further still because most people prefer larger homes (if money doesn’t matter). And finally, we continue to build small homes mostly in urban areas and larger homes in rural areas, a trend that needs to be reconsidered.
Who bears the consequences of the small housing shortage?
Affordable housing is becoming more expensive. Assuming that the housing shortage will not be solved by the end of this decade, what are the possible consequences? First and foremost it means that house prices and rents will continue to rise. Not considering policy interventions or severe economic shocks, there are few reasons to believe that prices . Prices are likely to rise relatively more for smaller and affordable homes, especially in rural areas where their supply is scarce. We can already observe this trend today. Figure 10 shows the house price index by housing type. In the period from 2012 to now, apartment prices have risen about 40% more than those of detached houses. In the same time period (13 years) from 2000 to 2012, the difference was only 8.5%, in favour of detached houses (not shown).
Young people are hit hardest by the housing shortage. People usually move around certain life events, such as finding a new job, having children, or adjusting to aging. These events usually occur at the beginning and toward the end of our lives. This means that younger and older households are more likely to be under pressure to find new housing than, say, established households. Younger households are also more often outsiders, meaning they do not yet own their own home. Therefore, first-time buyers are the . But young people often have fewer savings and lower incomes because they are at the beginning of their careers. In addition, they have the highest proportion of single-person households, making it harder to buy.
Housing costs for younger households are rising at the expense of family planning. To still get a foothold in the housing market, young people often take on high financial burdens leading to . This comes at the cost of other expenses or savings. Renters sometimes pay too much rent, giving them no room to build savings. However, buying a home requires equity and so does the percentage of . This may also have recoiling effects on the percentage of single-person households, as young couples their decision to marry or live together until they find a suitable homes. Housing affordability may also affect as couples might wait to have sufficient space and financial resources.
Among older households, ownership makes the difference. Older households are also greatly affected by the housing shortage. However, homeownership makes a big difference. Owners can often stay in their old homes, even though they may want to downsize or cash-out some excess housing value. The worst consequences are that they block relocation chains for others. Renters, however, are often worse off because they are under more pressure to move while having few options. Rents rise because of the shortage, which can be a problem if accumulated pensions are low. Old tenants often have long running, affordable lease contracts, making moving even further expensive. They can also not use any excess housing value to compensate the difference.
Incumbent owners will also feel the effect. Even though homeowners in general feel less pressure and may be happy with increasing prices, bringing up the excess value of their homes, they too may feel the effects. As mentioned at the beginning, labour productivity is at risk and service quality may be affected. Other effects are that divorces will become more complex because it is more difficult to find single-person homes and buy out the partner. Parents may feel the effects through their children, which may require them to use their own excess home value to co-finance their children's purchase.
The effects of working from home and retired baby boomers
Working from home and the aging of the baby boomers have implications for the housing shortage. The obvious solution to the housing shortage is to build more suitable homes. However, we want to look at two current trends that present challenges and opportunities for the housing shortage. The first is working from home. It became mainstream during the Covid-19 pandemic and quickly became an essential job requirement for many. However, it has also serious implications for the housing market. The other trend is the aging of the baby boomers. This generation constitutes the largest group in the Netherlands and is also the wealthiest. Soon they will retire and many may want to adjust their living situation by moving. We see this group has the most single-person households, which means a shock especially for the small housing segment. In the US, this effect already has a name: the silver tsunami.
Traditionally, work defines our living place. In urban economic theory, living and working are linked. Because travel is expensive, people usually live close to their work and are willing to pay a premium to save travel time. The amount of the premium is related to the potential income. Because jobs tend to be better paid in cities, the premium for not traveling is highest in cities, resulting in higher housing prices. Simply put: People with higher salaries in cities are willing to pay more for a house in the city to avoid long commutes to work. show empirical evidence of how commuting in cities also affects productivity. Longer commutes can lead to higher transportation costs, more travel time and less time for work and leisure, which can negatively affect worker productivity.
Working from home decouples home and work locations. Working from home reduces the need for people to come to the office. This reduces potential travel costs for a city job. The effect is relatively new, but from what we observe it results in longer distances between work and home locations. In the Netherlands, most cities can be reached within 2 hours travel. Such a long trip to work would have been unthinkable a few years ago, but if it is done only twice a week it seems feasible. As a result, people can work in the Randstad and don’t have to leave their rural province or they can simply live where living is more affordable.
It is a double-edged sword and not for everyone. Working from home can take . However, this comes at the expense of rural areas. Incomes in cities are often higher than in rural areas. Furthermore, working from home is often only an option for people with office jobs that usually pay higher salaries. So if single-person households move from urban to rural areas, they do not only create additional demand but can also often bid more for homes than locals. We can already see that prices in rural areas have risen much faster than in urban areas over the past 5 years, whereas the trend was reversed in the 5 years before that.
The effects of the silver tsunami. The second big trend to keep an eye on is the aging of the baby boomers. No other and for no other generation is the ownership rate as high. In the coming years, this group will retire, which will affect the housing market. Many households will be looking for a new home to live smaller or to cash in on their surplus value, for example. Because of the size of this group and their purchasing power, this can have serious effects on the housing market. Researchers are already calling this phenomenon the The move of baby boomers can cause supply shocks on the one hand and demand shocks on the other.
The effects depend on policy and demographic trends. In the Netherlands, the possible effects have not yet been well studied. assume that the massive sale of homes by baby boomers might lead to a supply shock and thus falling prices in the short term. However, this could be isolated to larger homes, which are currently more commonly occupied by baby boomers. On the other hand, if baby boomers want to live smaller and seek age-appropriate housing, they could also create a demand shock for small homes, raising prices in this segment. Therefore, the effects on the remaining housing market are mixed depending on the housing segment. Other considerations include the regional density of baby boomers, for example, in . This may lead to a regional oversupply. However, the Netherlands is relatively small, so this oversupply might be quickly absorbed by relocations.
There are opportunities, but we need to address them now. The silver tsunami is also creating opportunities in the housing market, but they require political support. A large group of homes are potentially becoming available. These houses could be split and made more sustainable. However, splitting is currently overly bureaucratic and difficult to finance, therefore it is often unattractive to owners. Tax regulations create tax disadvantages when releasing excess home values, creating a burden for older people to move. The government could consider changing some of these policies if it helps the housing market.
[1] This trend applies to all provinces, with the highest growth in Limburg, Zeeland and Groningen (not shown due to space limitations).
[2] The age of a household is determined by the age of the main breadwinner
[3] These are private households only, meaning they can take care of themselves (no nursing homes, etc.). Since relatively many elderly live in nursing homes, the actual proportion of that group might be slightly higher.