ESG Strategist - Higher climate risks do not yet translate into steeper credit curves

In this piece, we look at all issuers included in the Bloomberg euro corporate bond index (excl. financials) and assess whether companies more vulnerable to climate-related risks – physical or transition - also experience steeper credit curves
We evaluate exposure to climate risks by looking at mainly three variables: (1) The GHG emissions (scope 1, 2 and 3) intensity (tonnes per EUR million of revenue), (2) the ISS ESG physical risk score, and (3) the ISS ESG carbon risk
Our analysis indicates that these variables are not statistically significant in explaining curve steepness, while credit ratings are a significant factor
We also give each sector a score based on their transition and physical risk exposure in order to evaluate if investors demand wider credit spreads for longer-dated bonds from issuers that belong to sectors most vulnerable to climate risks
However, also here we do not find evidence to support our assumption that higher climate risks translate into steeper credit curves
Lastly, we zoom into the oil and gas sector to show that there is no evidence that credit curve steepness changed over the years, despite investors increasingly focusing on ESG risks
All-in-all the market is underestimating long term climate impact on issuers
As the impact of climate change in economic landscapes becomes more clear over time, investors increasingly turn their attention to its implications on credit bond markets. One of those potential implications regards credit curves steepness. As the longer-end part of a credit curve should– in theory – be particularly sensitive to long-term uncertainties, one would assume that also an issuer more exposed to climate-related risks would experience steeper credit curves in secondary bond markets. Hence, given that the impacts of climate risks are often gradual and accumulate over time, it is crucial to examine how these climate-related risks may lead to wider credit spreads on the long-part of the credit curve for issuers perceived to be vulnerable. We already explored that topic when assessing gas utility companies’ readiness towards the hydrogen transition (see download below). However, in this note, we also aim to expand such analysis to other sectors.
We start our analysis by gathering all the bonds included in the Bloomberg Euro Agg Corporate Excl. Financials Index (ticker: LECFTREU Index). This ensures that we focus on the companies more actively covered by corporate bond investors in the euro space. In order to evaluate the steepness, we take the average of z-spreads between the short- and the long-end part of the curve. We assume short-dated paper to be the bonds that have a maturity of less than 3 years, and longer-dated paper for the ones that have a maturity of more than 8 years. For issuers that have longer bonds outstanding (for example, over 15 or 20 years), the average might be skewed to the downside given the convexity of credit curves. To account for that, we also include a variable named ‘steepness years’ in our model, which is calculated as the difference between the average years in the short-end and the average years in the long-end part of the curve. As a sanity check, we also re-run the same exercise but then consider exclusively the bonds with a maturity between 2 and 3 years (short-end) and 9 and 10 years (long-end). This, however, significantly reduces our sample size. For the purpose of this analysis, we also focus exclusively on senior bonds.
To account for climate risks, we look at three main variables: (1) The GHG emissions (scope 1, 2 and 3) in tonnes per EUR million of revenue, which should capture the companies’ exposure to transition risks; (2) the ISS ESG physical risk score, in which issuers with a lower score have a higher relative exposure to physical risks; (3) the ISS ESG carbon risk rating, which scores issuers across over 100 carbon performance indicators and assess the company’s ability to reduce footprint across the full value chain (a lower score indicates a lower ability to reduce future carbon emissions).
No evidence of steeper curves for issuers with higher climate-related risks
Using the methodology described above, we are left with 84 issuers, that have both curve steepness (short- and long-dated paper) as well as climate-related data. We run a simple OLS (linear) regression to account for other factors that could be impacting the curve steepness, such as the credit rating (as discussed above) and the variable named ‘steepness years’. Results are presented below.
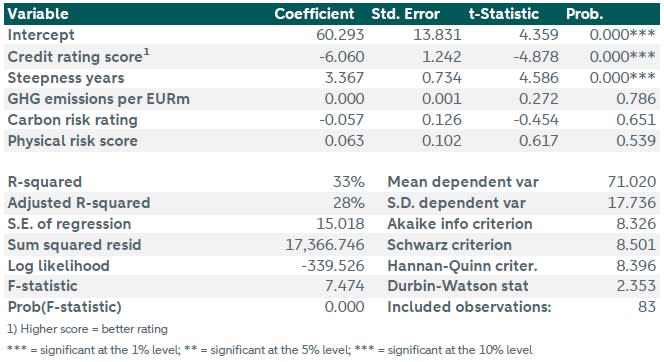
From the table above, it is possible to see that there is no evidence that higher climate-related risks translate into steeper credit curves (the climate variables are not statistically significant). Also the coefficient sign for the variable ‘physical risk score’ does not seem to have economical significance, as our analysis indicates that an issuer with a higher score (less exposed to physical risks) would have steeper curves, all else equal. On the other hand, as we expected, a better credit rating and less steepness in terms of average number of years translate into flatter credit curves – and these results are statistically significant.
As a next step, we also assess the issuer’s exposure to both, physical and transition risks, from a sector perspective. As such, we score each sector based on how exposed it is to physical and transition risks. We do so in order to understand whether investors also ‘penalize’ issuers that belong to a sector that is more vulnerable to climate-related risks, such as oil and gas. For our assessment, we score sectors based on their exposure to transition risk using the ECB assessment based on the sectors with highest absolute change in probability of default (see ). For physical risks, we use MSCI data (see ). A lower score indicates a higher exposure to climate risks. The results are presented below.
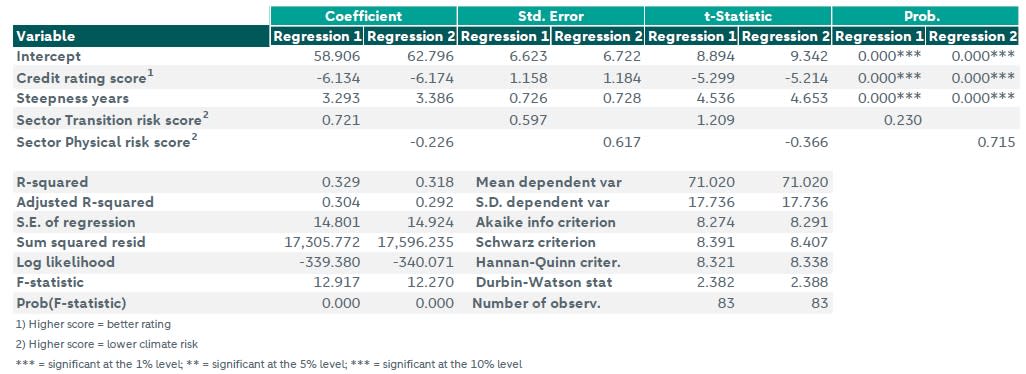
Once again, the results presented in the table above indicate that there does not seem to be any relationship between an issuer’s curve steepness and the climate risks of the sector it belongs to, as evidenced by the lack of statistical significance for the coefficients of the variables ‘sector transition risk score’ and ‘sector physical risk score’. Furthermore, also the ‘sector transition risk score’ coefficient does not have economic significance, as the model now indicates that a higher score (lower climate risk) translates into steeper curves. As such, also here our analysis indicates that investors do not seem to be differentiating between sectors on the basis that they are more or less exposed to climate-related risks.
Narrowing the definition of curve steepness
As we previously mentioned, as part of a sanity check, we also re-run the same exercise but then considering exclusively the bonds with maturity between 2 and 3 years (short-end) and 9 and 10 years (long-end). This, however, significantly reduces our sample size. As such, readers must take the results hereby presented with a pinch of salt. The results of this analysis are presented below.
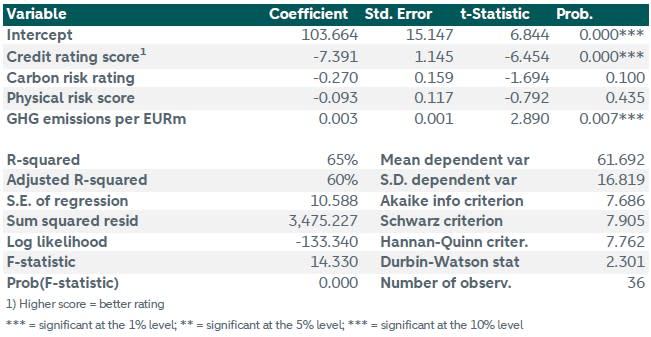
Here, we seem to find some evidence that climate-related risks result in steeper curves, particularly for issuers with a high carbon intensity (high GHG emissions tonnes per EURm of revenues). However, the resulting impact in curve steepness – captured by the coefficient size – is very small. More specifically, an increase of 1 ton/EURm would result in only a 0.003bps increase in curve steepness – a negligible amount. Also regarding the variable carbon risk rating, our model indicates a marginal significance at a 10% level. The results also point to a correlation that implies that a higher carbon risk rating score (better ability to reduce GHG emissions) results in flatter curves. However, also here the magnitude of the impact is very small. A company with a one unit higher (better) carbon risk rating score would have a 0.27bps less steeper curve between the 3 and 10y maturities. As such, even under a smaller, and more specific sample we still do not find evidence that climate risks translate into steeper credit curves.
Can we find evidence in specific sectors?
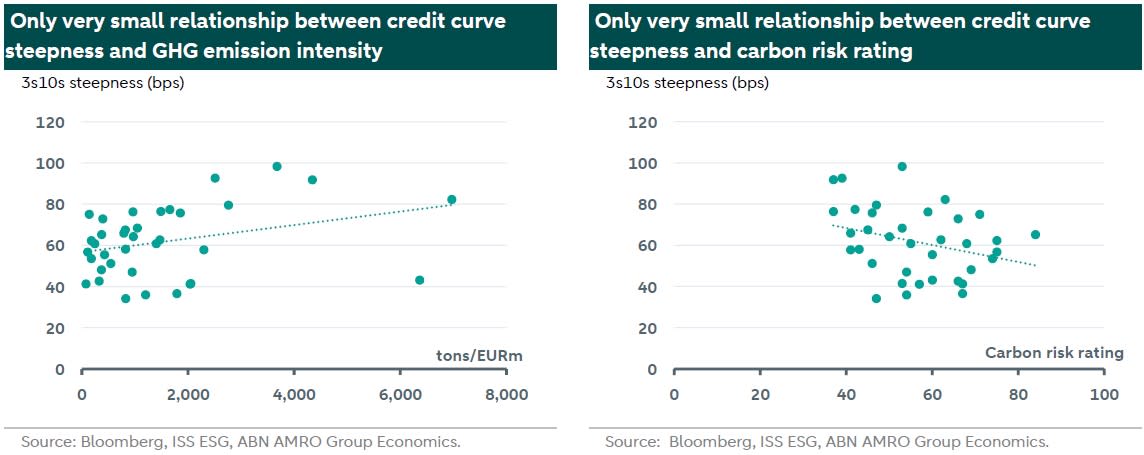
Lastly, we evaluate whether we can find evidence of a difference in curve steepness across issuers in the oil and gas, as well as, utilities sectors. These sectors are known to have high transition and physical risk exposure (see for example an analysis done by Banque de France ). We look once again at the three climate-related variables we considered previously: (1) The GHG emissions (scope 1, 2 and 3) in tonnes per EUR million of revenue; (2) the ISS ESG physical risk score; and (3) the ISS ESG carbon risk rating. As the sample is very limited (for example, only six issuers in the oil and gas space), we assess the relationship between curve steepness and climate indicators by plotting the results in a scatter plot graph. This is presented on the next page for variables (1) and (3).
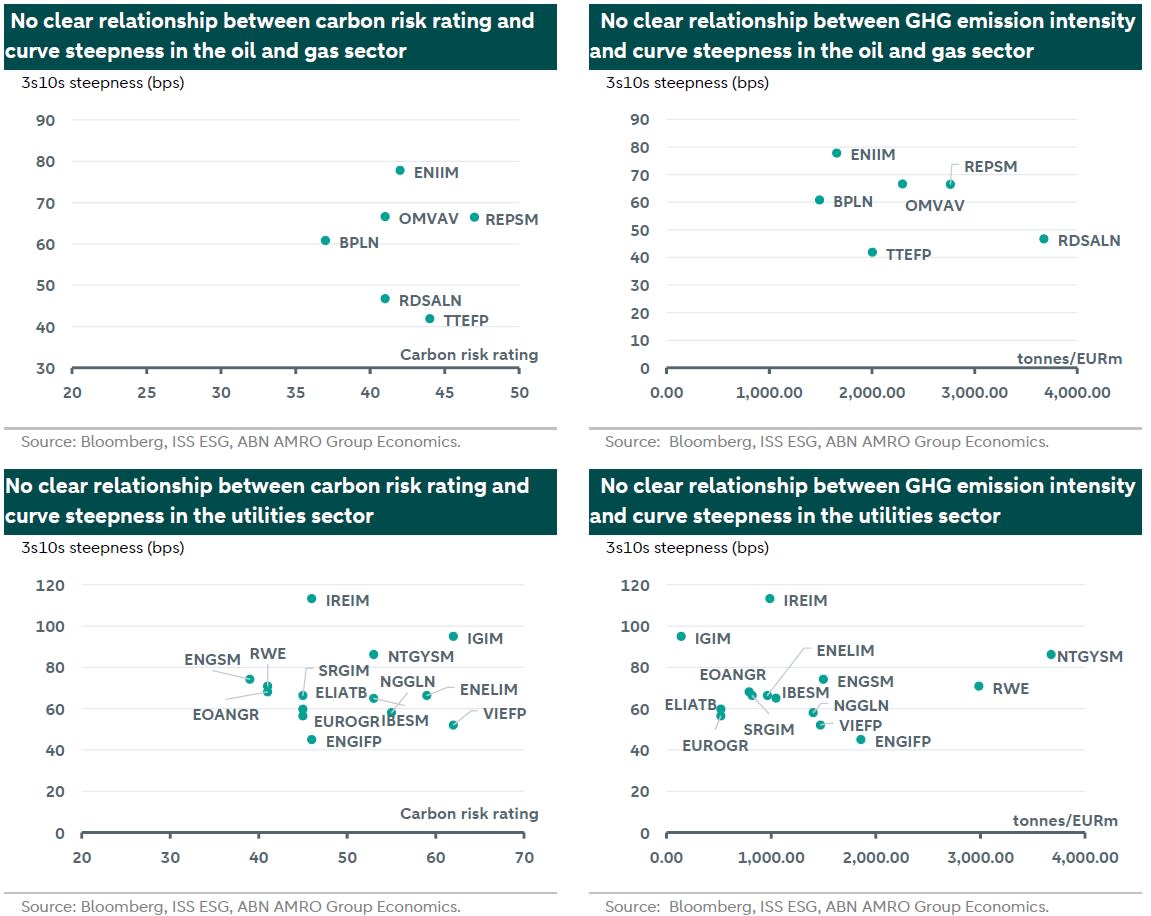
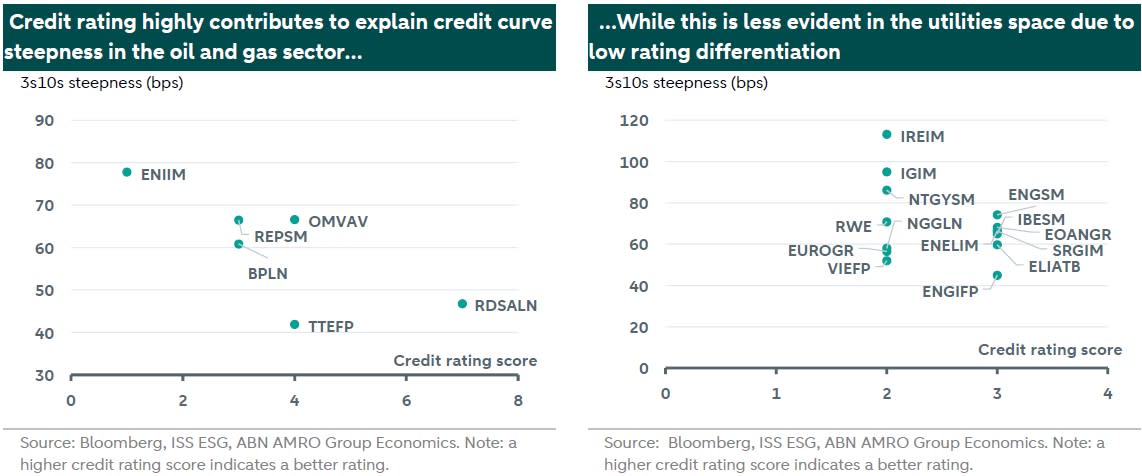
Again, our findings seem to indicate that there is no relationship between curve steepness and climate-related risks even when considering only the oil and gas and the utilities sector. At the same time, once again, we clearly see that credit ratings seem to be a large contributor to the credit curve steepness (see charts below). This is particularly the case for the oil and gas sector, where there is more credit rating differentiation.
Finally, we try to assess whether there has been any change in the curve steepness over the years. This is demonstrated on the chart below, where we assess the 3s10s steepness for issuers in the oil and gas sector. We look at the same issuers as in the previous exercises, and extract the bonds from these issuers that used to be part of the Bloomberg Euro Agg Corporate Excl. Financials Index on the months of December 2015 and 2017. We rank the issuers from lower to higher carbon emission intensity (using the existing footprint, as such climate data was not available on these years – we assume that the ranking in terms of carbon emission intensity across these issuers did not change significantly over the years). This allows us to evaluate not only steepness over time, but also whether investors used to differentiate across high- or low-emitting issuers.
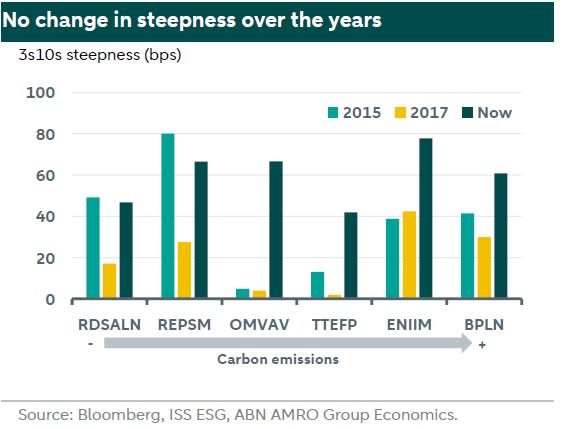
From the chart above, it is possible to see that there does not seem to be strong evidence that curve steepness has materially changed (increased) over the years. One would expect that, as investors become more advanced in their ESG screening approach, and as ESG increasingly becomes a material risk to be considered in investment decisions, that curve steepness for oil and gas companies would also increase. However, evidence seems to point otherwise. In fact, despite for Eni, where curve got steeper over the years, we cannot see any increasing steepening over the years. Furthermore, also regarding the carbon emission intensity ranking, we do not see evidence that investors have also started to apply over the years a higher curve steepness for issuers that have a higher carbon footprint.
Conclusion
Our analysis indicates that, despite growing awareness of climate risks by the investment community, there is no significant evidence that these risks influence credit curve steepness. Neither greenhouse gas emissions nor sectoral climate vulnerabilities appear to impact the curves in a meaningful way. Instead, credit ratings remain the primary driver of curve steepness, particularly in sectors like oil and gas. Furthermore, over the years, we observe no substantial changes in steepness related to ESG considerations. As investors continue to integrate ESG factors into decision-making, it remains crucial to monitor these dynamics, though current data reflects limited differentiation based on climate risk exposure.
