ESG Strategist - Green covered bonds take spotlight at start of the year

Total supply of ESG-labelled euro bank bonds in January 2024 decreased in comparison with the same period last year. While in previous years, most ESG-labelled bonds were in senior format, this year, covered bonds are leading. The increase in ESG covered bond issuance is likely the result of issuers taking advantage of the format to tap the market with longer-termed bonds, securing a larger pool of investors. The difference in maturities between ESG and non-ESG covered bonds can help explain why there is hardly any funding advantage (at first glance) of issuing in ESG, given that the average NIP does not correct for differences in maturity. Still, BTC ratios indicate that the pool of investors interested in ESG labelled bonds is considerably larger than that for non-ESG labelled bonds. Despite the stronger ESG issuance in covered bond format, we still expect issuance of ESG-labelled senior paper to pick-up this year, given the clear pricing advantages compared to regular equivalents.
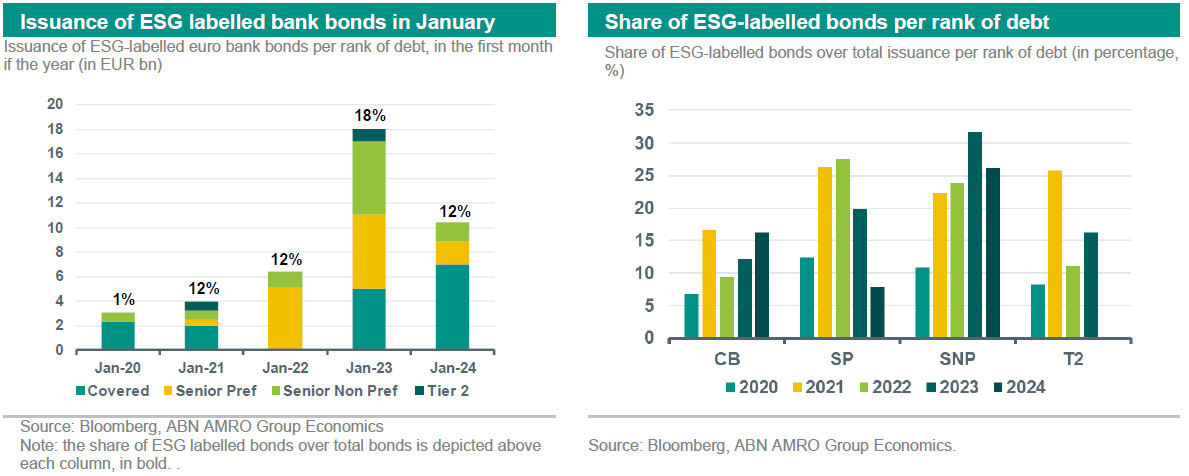
2024 started on a very positive tone in the euro bank debt market as investors await the start of central bank rate cuts. Nevertheless, total supply in the first month of the year was not as high as that registered in January 2023. Indeed, supply of euro bank debt totalled EUR 90.4bn in January, while that was EUR 104bn during the same period last year – a decrease of 15%. This was also reflected in the ESG space. The supply of ESG bonds decreased both in absolute and relative terms. While in 2023, supply of ESG-labelled bonds in January totalled EUR 18.05bn (17% of total euro issuance by banks), supply in 2024 totalled only EUR 10.4bn – close to 12% of total issuance. The latter was more in line with issuance in 2021 and 2022, when supply of ESG bonds also amounted to 12%.

A breakdown by debt rank shows that the ESG covered bond market started the year on a relatively strong note (see chart above on the left). While in 2021 and 2022, most ESG labelled bonds were in senior format, in 2024 they have been mostly in the form of covered bonds. Out of the EUR 10.4bn ESG bonds that were printed in January this year, 7bn (or 67%) were covered bonds. This represents an increase of close to 40% in comparison to January 2023, when issuance of ESG-labelled covered bonds totalled EUR 5.05bn.
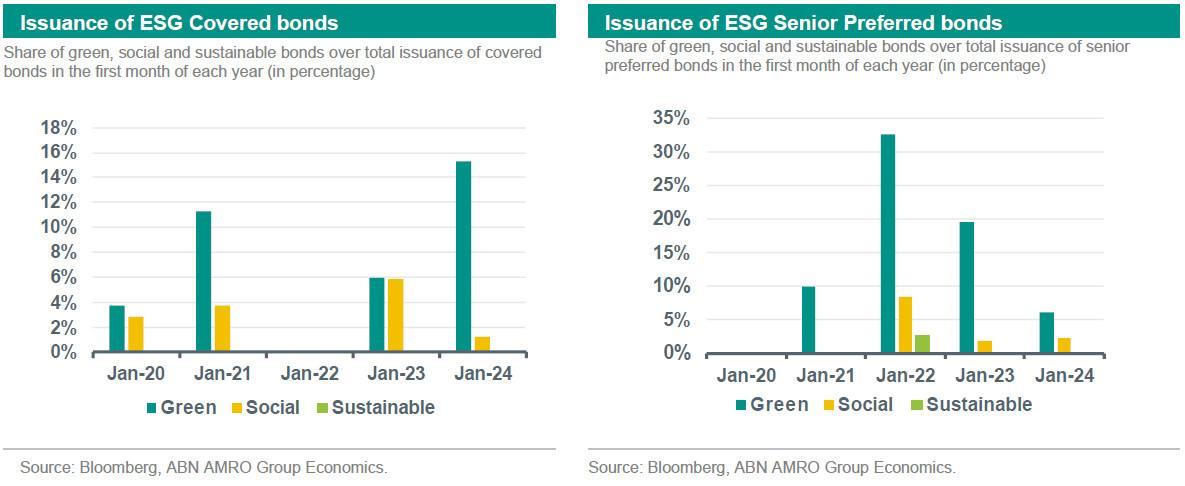
The decrease in senior bonds in ESG format is also visible in the chart on the right hand side. For example, the share of ESG labelled bonds with a senior preferred ranking has been decreasing considerably since 2022. For instance, in January 2022, the supply of ESG-labelled bonds totalled EUR 6.4bn, of which EUR 5.15bn were in senior preferred format (or 80%). That share decreased to 33% in January 2023, and this year, it dropped further to less than 20%. Also, in the senior non-preferred (SNP) space, the share of ESG-labelled bonds in total SNP issuance has been declining since last year. On the other hand, the share of ESG covered bonds over total covered bond issuance has been on a steady rise since 2022.

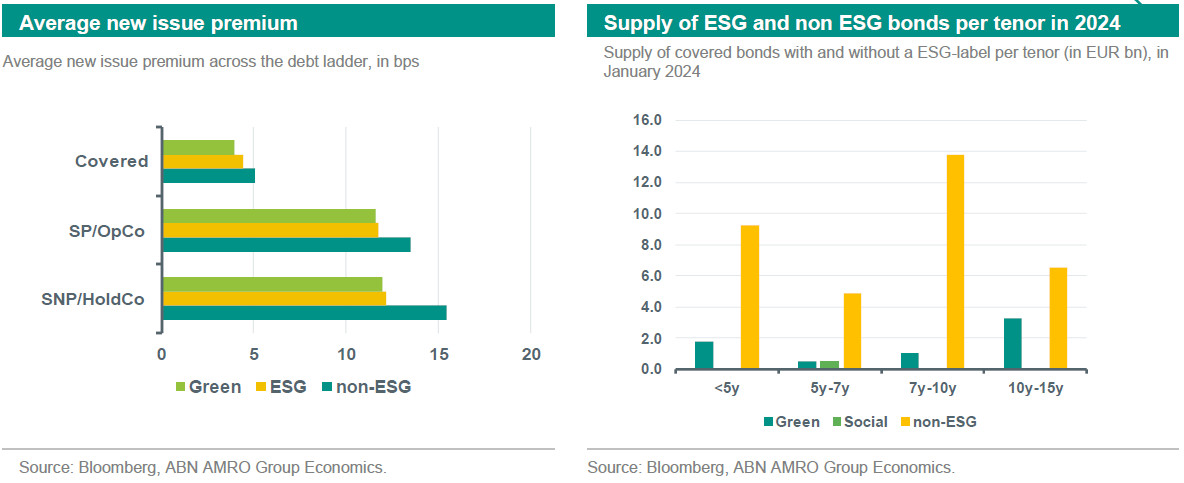
One possible reason for the sudden increase in ESG covered bonds issuances could be related to the greenium. However, when looking at the difference between the average new issue premium (NIP) paid for ESG covered bonds and regular ones, that explanation does not seem to be supported. As the graph below indicates, while issuers have on average conceded a NIP of 5bp on non-ESG bonds, that number is close 4.4bp for ESG bonds (slightly lower for green bonds), resulting in a neglectable difference.
Nevertheless, it is also important to look at the maturity profile of the new bonds. For instance, if ESG bonds have a longer maturity than non-ESG bonds, we expect the former to pay higher or similar new issue premiums to the latter. As we can see in the graph below on the right, in January 2024, most of the supply of covered bonds with a ESG label had indeed a longer-maturity (in the 10 to 15y bucket), most likely explaining the negligible difference in the average NIPs between ESG and standard bonds Moreover, another explanation for the minor NIP differential is that the majority of ESG covered bonds came from less frequent covered bond issuers, such that the ESG format could have been used as a tool to support demand.

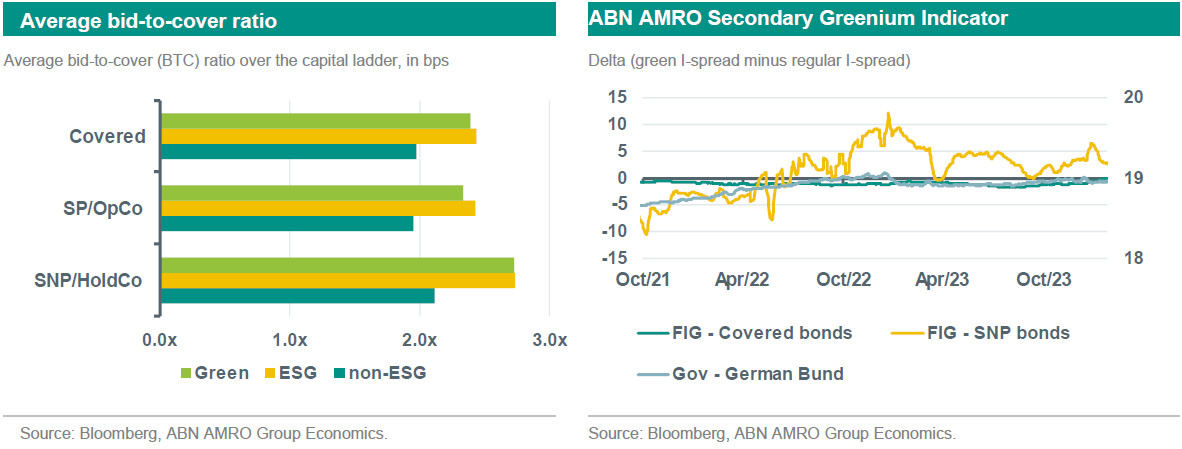
On the other hand, if we look at bid-to-cover (BTC) ratios, demand has been, on average, considerably larger for ESG-bonds. This might help to explain why issuers are issuing more and more ESG covered bonds: the pool of investors interested in ESG covered bonds is larger than that for non-ESG bonds. And, it might also explain why most green bonds have been issued with longer durations: to guarantee a larger pool of investors and the success of longer-dated deals.

One month does not offer enough data to draw meaningful conclusions or infer future trends. That being said, we still expect issuance of ESG senior bank bonds to pick up during the remainder of the year, given that there are indeed pricing advantages of issuing a ESG-labelled bond over a standard one in the senior space. On average, non-ESG senior bail-in bonds paid 15.4bp of new issue premium, while ESG senior bail-in bonds paid an average NIP of 12.2bp, making it more attractive for issuers to issue a green bond. Furthermore, demand for senior ESG-bonds has also been much larger than for equivalent non-ESG bonds, which confirms once again that the pool of investors looking for ESG bonds is larger than that for standard bonds. Hence, advantages of issuing in an ESG format make it likely that banks will increase the issuance of ESG senior bonds during the course of this year.
