ESG Economist - What are the main trends in Dutch climate investments?


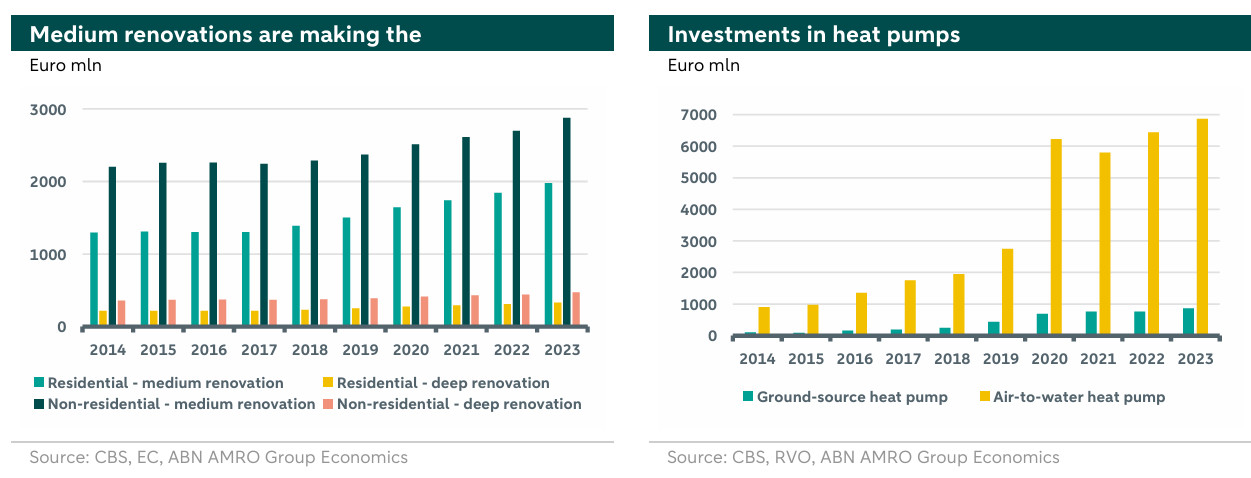
The analysis of the main climate sectors reveals distinct trends across various technologies. In the building sector, there has been an uptick in investments in new buildings with a significant rise in air-to-water heat pumps from 2020 onwards. Medium renovations in existing buildings are also on the rise in the past decade.
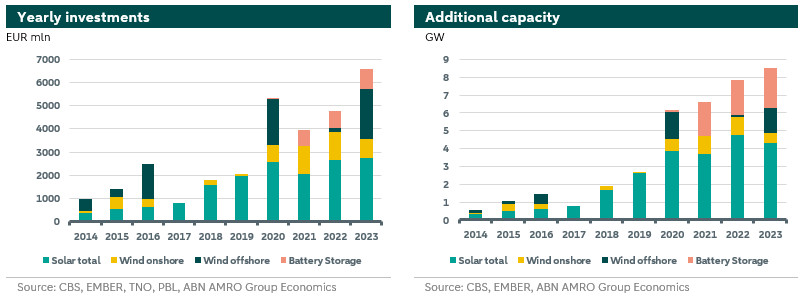
The energy sector has a spread in investments across different technologies, with solar and wind in the lead, while investments in flexible solutions such as battery storage is emerging since 2019
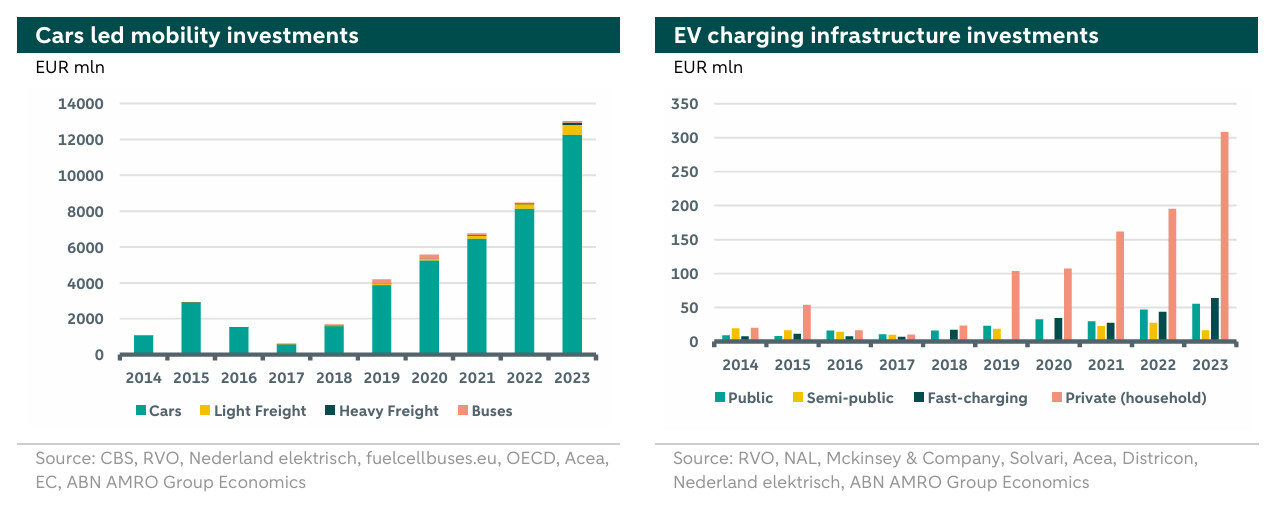
In the transport sector, investments in electric vehicles are in the lead while there are relatively lower investments in the infrastructure
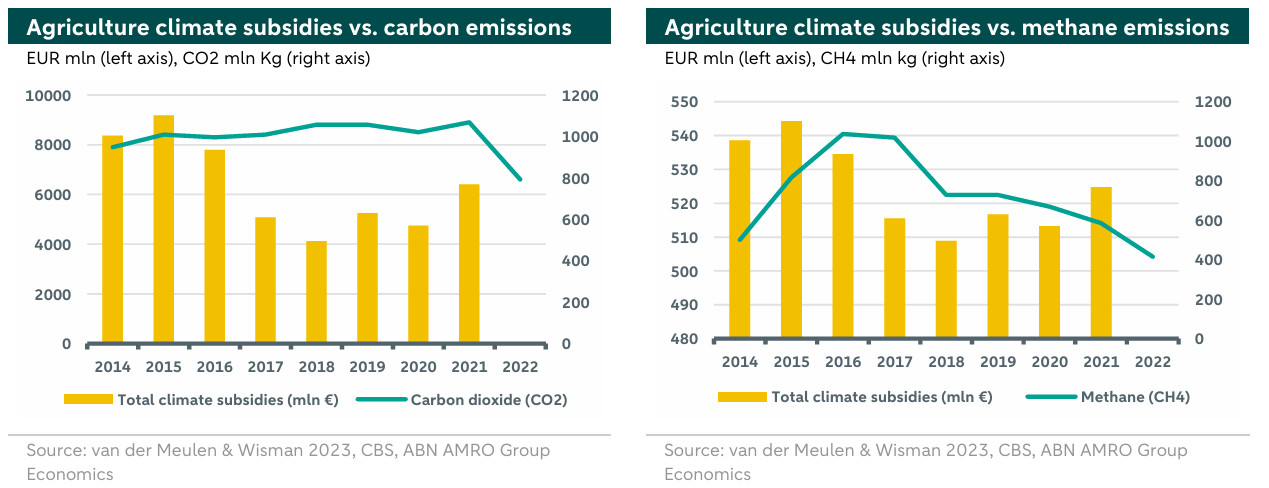
In agriculture, MIA and VAMIL subsidies have played a significant role in subsidizing climate investments over the past ten years
Agriculture methane emissions manifested a reduction that is correlated with an increase in climate subsidies
Climate investments in industry are taking off where permits are issued, technologies are developed, and projects are launched
Among different industries, the chemical industry stands out with the highest climate investments
This note is based on the outcome of a collaboration between ABN AMRO bank and Utrecht University. Data collection and initial drafting is done by: Pallavi Pervela, Florence Gommers, Yu-Chin Chang, Brigitte Mulder, and Maud Steinmann.
Introduction
The energy transition has several channels, namely: electrification wherever possible; efficiency improvements (using less resources for the same output), the development of alternative sustainable fuels, capturing emissions, and switching towards renewables in power generation. All these channels involve more investments across different sectors: so-called climate investments. Accordingly, tracking climate investments would help to monitor the progress of the transition along with highlighting any particular trends, patterns, or challenges to inform relevant stakeholders or investment decisions.
For our purpose, climate investments are defined as specific target initiatives to mitigate climate change and promote sustainability, distinct from broader environmental/sustainability investments, which encompass a wider array including water and biodiversity initiatives. Accordingly, this note aims to combine macro and micro frameworks from the transition literature to gain insights into the historical trends in climate investments in the Netherlands during the past decade within main sectors. Looking forward, we will provide updates on these numbers as updated numbers become available, as well conducting analysis on how investment trends compared to what is needed for a 1.5-degree pathway.
The built environment
Within the built environment we distinguish between investments in residential buildings and non-residential buildings with a further distinction between medium (with energy saving between 30% and 60%) and deep (with energy savings higher than 60%) renovations.
As shown in the chart below (left), there is a general upward trend from 2019 to 2023, indicating a growing focus on intensive energy-saving measures for buildings. This trend is possibly driven by the Energy Performance of Buildings Directive (EPBD) target to double energy retrofit rates by 2030, along with the energy crisis following the Russian invasion to Ukraine. Throughout this period, medium renovations consistently receive higher investment compared to deep renovations as those former investments are less fundamental and more financially accessible. Non-residential renovations, both medium and deep, generally attract more investment than residential renovations, likely due to the larger pool of non-residential buildings in general, or more attractive incentives for non-residential energy savings. The EPBD also mandates that EU member states gradually implement minimum energy efficiency standards for non-residential buildings, prompting the renovation of buildings with the lowest energy efficiency.
The Dutch government has stipulated that, starting from 2023, every office building exceeding 100 square metres must possess an energy label of at least C. Looking forward, the Dutch government aims to have existing buildings achieve at least average label A by 2030. It is expected that investment in both medium and deep renovations will continue to rise significantly.
Although the total investment in heat pumps fluctuates to some extent, the overall investment is on an upward trend, indicating accelerating sales growth. It follows a similar growth trend as that in new residential buildings. Starting at around EUR 1 billion in 2015, and following the energy crisis, total heat pump investments (both ground source and Air to water heat pumps) reached EUR 8 billion in 2023.
Heat pumps (excluding air conditioners) installed in Dutch households have increased dramatically over the past ten years, with more than 340,000 units, with growth of 533%. There is an opportunity to make a positive contribution to the EU-wide target of deploying 30 million heat pumps by 2030 compared to 2020 set by REPowerEU plans.
The investment in ground-source heat pumps has remained relatively low from 2014 to 2023, with a slight increase after 2020. In contrast, air-to-water heat pumps show a significant and consistent upward trend in installation value over the same period, with particularly sharp growth from 2019 onwards, reflecting their increasing popularity and adoption. It is possible that air-to-water heat pumps have significantly outperformed ground-source heat pumps in terms of installation cost and ease of installation.
The energy sector
The energy sector data focuses on investments in, solar, wind, battery storage and grid extension. Solar investments have been the rising star among renewables in the Netherlands picking up strongly following the reduction in the cost of solar panels in recent years, along with higher incentives following the energy crisis and subsidy schemes. Solar power provides now as much as 17% of total power supply in the Netherlands.
Investments in onshore wind have been also increasing since 2020 with highest additional capacity in 2021 with 1.03 GW. On the other hand, investments in offshore wind do not have a clear trend over the last 10 years. However, 2016, 2020, and 2023 stand out as years with highest investments in offshore wind, mainly because offshore wind takes more time in the development phase. Finally, as illustrated in the chart above (right), investments in battery storage have started to prominently materialize since 2020, which is also related to the reduction in the cost of utility scale batteries along with the higher need for flexibility solutions following the ongoing grid congestions in the country.
The chart above (left), further manifest those overall investments in renewables and battery strongly increased starting from 2020. The Dutch government policies have played a crucial role in this trend, with different subsidy schemes such as SDE+, SCE and the net metering scheme (salderingsregeling).
The transport sector
For the transport sector, investments were estimated across 2 sub sectors namely vehicles and infrastructure. In vehicles, electric vehicles were considered across 4 segments i.e. passenger cars, light freight, heavy freight and buses. Technologies considered are Plug-in Hybrid Electric Vehicles (PHEV), Battery Electric Vehicles (BEV) and Fuel-cell Electric Vehicle (FCEV) across these segments. In infrastructure, investments made in (4) different types of Electric Vehicle (EV) charging stations and railway line electrification were considered. Overall, 47.5 billion euros has been invested in these two sub-sectors in this period.
As can be seen in the chart on the right above, climate investments in cars constitute the biggest share of investments. Within cars, BEV and PHEV cars are most popular. The number of FCEV cars is still very low. In the initial years, PHEV cars were more popular, especially among company owned cars, because of tax exemptions from vehicle registration and road tax . However, these were gradually increased to equal taxes on combustion engine cars. Hence, there is a downward trend from 2015 to 2018 and an upward trend 2018 onwards. The rapid rise in car investments 2018 onwards is also primarily driven by fleet/company car sales in BEV.
BEV and PHEV heavy and light freight vehicles were purchased in very low numbers in the beginning of the period due to extremely high costs. But this has slowly changed over the years. Main drivers were as follow. First climate policy has become more stringent. Indeed, targets for zero emission vehicles have been brought forward. Second, the costs of battery technology have decreased. Third, there is slow growth in electric vans (light freight) from 2020 onwards. Growth in heavy freight vehicles, however, is still constrained by battery technology limitations, high costs, and limited charging infrastructure. The charging infrastructure for these vehicles need higher capacities ().
For buses, the Voluntary Agreement on Zero Emission Bus Transport policy states that all new buses must use 100% renewable energy or fuel from 2025 onwards. And all buses must be fully emission-free from 2030. A significant proportion of the Dutch bus fleet is electric and there is a small rise observed in 2019 and 2020.
Investments are calculated by multiplying additions to fleet size in vehicles and charging stations by the price and/or costs of such stations. Price data for freight vehicles from 2014-2020 are based on assumptions since such data was not available. Price data for buses was available for a few years so for the years where data were missing, prices were calculated using averages between the two closest years.
Investments in public charging stations and private home chargers are the highest and have grown steadily (chart on the right above). This is mostly due to rapid growth in the number of chargers installed. Federal commitment (National Infrastructure Agenda), detailed tender guidelines for municipalities, and established market of home chargers has facilitated this growth in installation. Fast charging technology was still developing in this period as costs continued to be high and capacities also increased over time. Fast charging capacities were only 50 kWh around 2017 whereas Rail electrification was stable through this period and saw no major investments.
The agriculture sector
The majority of total climate investments in the agricultural sector are partly funded through subsidies (Chiriac et al., 2020; van Gelder et al., 2022). The government is one of the main actors that plays a crucial role in promoting sustainability actions by granting those subsidies. Other investments are made by farmers. Due to a lack of consistent investment data for this sector, we focus on climate subsidies which are supposed to be proportional to climate investments and thus could be considered as a proxy for these investments. The overall climate subsidies data is sourced from Wageningen University and Research and CBS (van der Meulen & Wisman, 2023; CBS, 2024). However, the data is only available until 2021. With regard to total climate subsidies, there has been a large decrease of 69% in subsidies between 2015-2018 as can be seen in the yellow bars in the chart below (both left and right).
Over the past ten years the Environmental investment deduction (MIA) and Arbitrary depreciation of environmental investments (Vamil) subsidies played a large and significant share in climate subsidies within the Netherlands. In livestock farming, the subsidies are primarily allocated towards optimizing sustainable barns (partly in arable farming & horticulture), such as developing techniques to reduce emissions or implementing manure processing installations that recover phosphate, nitrogen, methane and carbon dioxide. Moreover, there are subsidies like ‘Fine Dust’ (years 2014-2016) later known as ‘Air Washer’ (year 2017), EIA, MEI, and general environmentally friendly investments that mostly focus on emission reduction. The last four are also applicable in arable farming & horticulture.
In arable farming & horticulture, subsidies are used in Green Label Greenhouses, Green Label Greenhouses for organic cultivation, and GHGs for environmentally friendly production with an eco-label. Since 2018, several new subsidies have been introduced to stimulate climate investments, an increase of 63% towards 2021. One notable example of this increase is the POP3 subsidy, which invests nearly 50 million euros annually (van der Meulen & Wisman, 2021).
We are interested in investigating the impacts of climate subsidies on emissions with a focus on carbon dioxide (CO2) and methane (CH4). With regards to CO2, no clear correlation is found as illustrated in the above chart (left). On the contrary, for methane, the right-hand chart shows that Methane emissions trends follow closely those of the subsidies. Namely when the amount of subsidies increases, the amount of emissions decreases in the years 2017 for CH4. Reasons for the reduction of CH4 include improved fermentation processes, choosing different types of feed composition, a decrease in the total number of livestock animals, and technologies to remove manure and clean barns daily (Brand, 2023).
Dutch industry
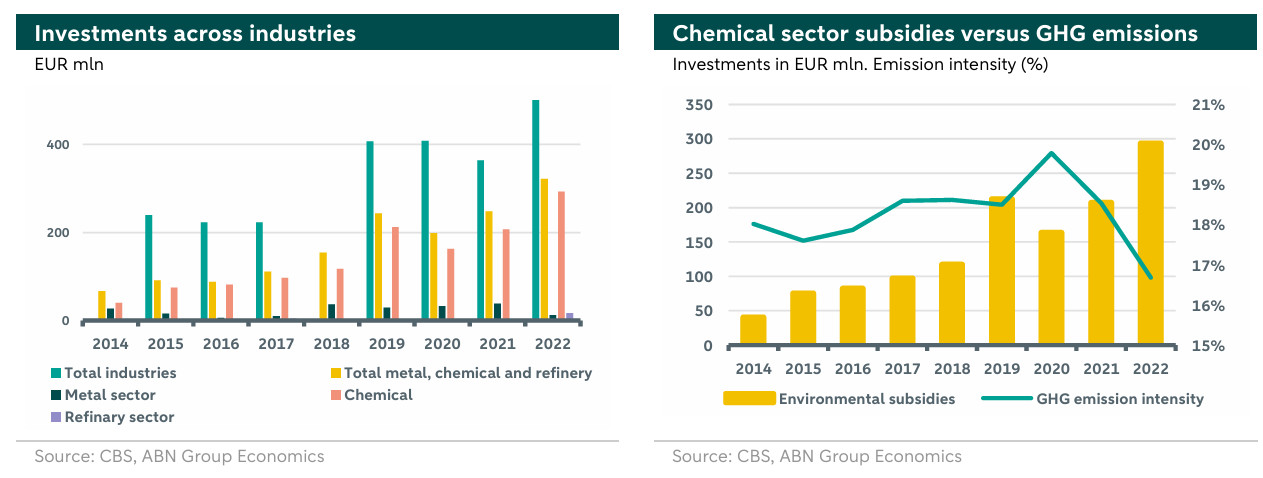
Within the Dutch industry sector there are the six important clusters, which consists of companies working together to implement large scale technologies. Moreover, the government plays a large role in promoting sustainability actions through different kinds of subsidies. According to CBS data, the percentage of the chemical, refinery and metal environmental investments increased substantially in the past decade. In 2015 these industries represented only 38% of total industry investments while in 2021 their share reached 68% of total investments in the industry sector as illustrated in the chart below (left).
The environmental investment data comes from CBS. The data is only available till 2022. 2023 data will be published in the third quarter of 2025. The definition of environmental investments used by CBS is: “The sum of the annual net costs of own environmental measures, plus levies, subsidies and payments for environmental services paid, less levies, subsidies and receipts for environmental services received”.
Next to environmental investments, subsidies also play an important role in climate investments within the industry sector. Some of the subsidies mentioned in the dataset are targeting different phases of innovation projects. For the industry sector, most projects are still part of the research & development and demonstration phases. Only few projects are already part of the upscaling and market introduction phase. Moreover, when looking into the projects which are done in the past and projects which are planned, the largest projects are with CCS (Porthos and Aramis) and hydrogen projects. Examples of big hydrogen projects which are at the start-up phase are Holland Hydrogen 1, H2-fifty, H-vision, and H2ermes.
Among different industries, the chemical industry stands out with the highest climate investments. Within the chemical industry, companies primarily concentrate their focus on carbon capture and storage (CCS), electrification, and hydrogen technologies. Over the past decade, emission intensity in the chemical sector have fluctuated as illustrated in the chart above (right). The chart manifests a positive relationship between subsidies and a reduction in emission intensity, which suggests that these environmental investments are effective in reducing the chemical industry’s emissions within the Netherlands.
To summarize
The analysis of the main climate sectors reveals distinct trends across various technologies. In agriculture, MIA and VAMIL subsidies have played a significant role in climate subsidies over the past ten years. Among different agricultural emissions, only methane (CH4) showed a reduction in 2017, correlating with the increase in climate subsidies. In the building sector, there has been an uptick in investments in new buildings, alongside a significant rise in air-to-water heat pumps from 2020 onwards, while medium renovations in existing buildings are on the rise over the past decade. In contrast to the building sector, the energy sector has a spread in investments across different technologies, with solar and wind being in the lead, while investments in battery storage have been emerging since 2019. Climate investments in the industry sector are taking off, where permits are issued, technologies are developed, and new projects are launched. However, only few projects are already part of the upscaling and market introduction phase. Among different industries, the chemical industry stands out with the highest climate investments. These investments are effective in reducing the chemical industry’s emissions. In the transport sector, investments in electric vehicles are in the lead while there are relatively lower investments in the infrastructure. Fuel engine cars have a role in the future of the transport sector, where the hydrogen solution could be of great impact.
