ESG Economist - Dutch grid delays cost up to EUR 376 million every year

The Netherlands has ambitious transition targets for its power sector, with the aim of reaching a CO2 free power sector by 2035. Limited grid capacity forms a bottleneck that hinders the deployment of new renewable capacity, threatening the timely and orderly achievement of climate goals. The long lead time in a queue reduces the viability of renewable energy projects and deter investments. The Netherlands has 3.54 GW of additional renewable capacity in queues waiting for grid connection. Based on this potential capacity, we estimate that every year of delay of grid expansion in the Netherlands would lead to carbon costs that range between 329 and 376 million euros.
Part of this note is based on the outcome of a Master thesis by Stefan Schulte supervised by Prof. Madlener at the Chair of Energy Economics and Management at RWTH Aachen University. Stefan Schulte is a Data Scientist at ABN AMRO and a main co-author of this publication.
The Netherlands has ambitious transition targets for its power sector, with the aim of reaching a CO2 free power sector by 2035.
Limited grid capacity forms a bottleneck that hinders the deployment of new renewable capacity, threatening the timely and orderly achievement of climate goals.
The long lead time in a queue reduces the viability of renewable energy projects and deter investments.
The Netherlands has 3.54 GW of additional renewable capacity in queues waiting for grid connection.
Based on this potential capacity, we estimate that every year of delay of grid expansion in the Netherlands would lead to carbon costs that range between 329 and 376 million euros.
Introduction
The energy transition is gaining momentum all over the world. Electrification, energy efficiency, and the switch towards renewables for power generation are the main channels of the transition process. However, such process is unprecedented and bottlenecks are emerging, which threatens the reach of climate targets in a timely and orderly manner.
One of the prominent bottlenecks facing the energy transition in many European countries is the underdevelopment or insufficient capacity of supportive infrastructure. For example, the limited grid capacity in the power sector. Such limited capacity restricts the accessibility of new projects to the grid, which in turn limits the expansion and rollout of renewables and ultimately discourages the electrification process. More specifically, in the absence of adequate grid capacity, some renewable investments are either not happening or being postponed (which in this case, also negatively impacts returns and the financial viability of these projects). Furthermore, projects on alternative fuels that depend on renewables as a main input, such as green hydrogen, are also put on hold, affecting in consequence, the transition of other sectors, such as hard-to-abate industries (shipping and steel) that have limited viable options to reduce emissions.
Currently, there are long queues of renewable projects waiting for a grid connection in the Netherlands. In this note, we aim to quantify the materialized carbon emissions associated to the postponement or delay in renewable projects due to the limited grid capacity or other factors, such as prolonged procedures or permitting processes. These emissions can be expressed as carbon costs in terms of EU ETS allowances.
Dutch goals for renewable power
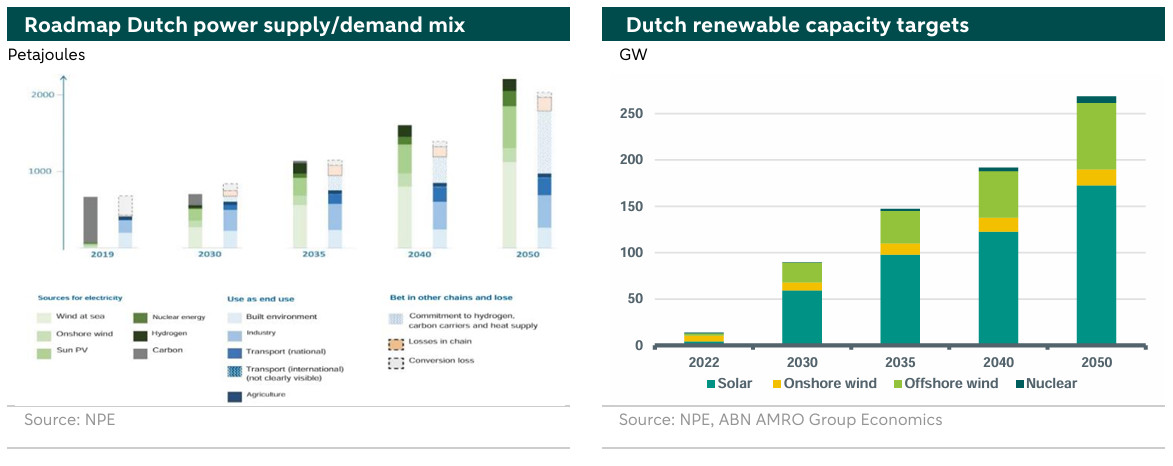
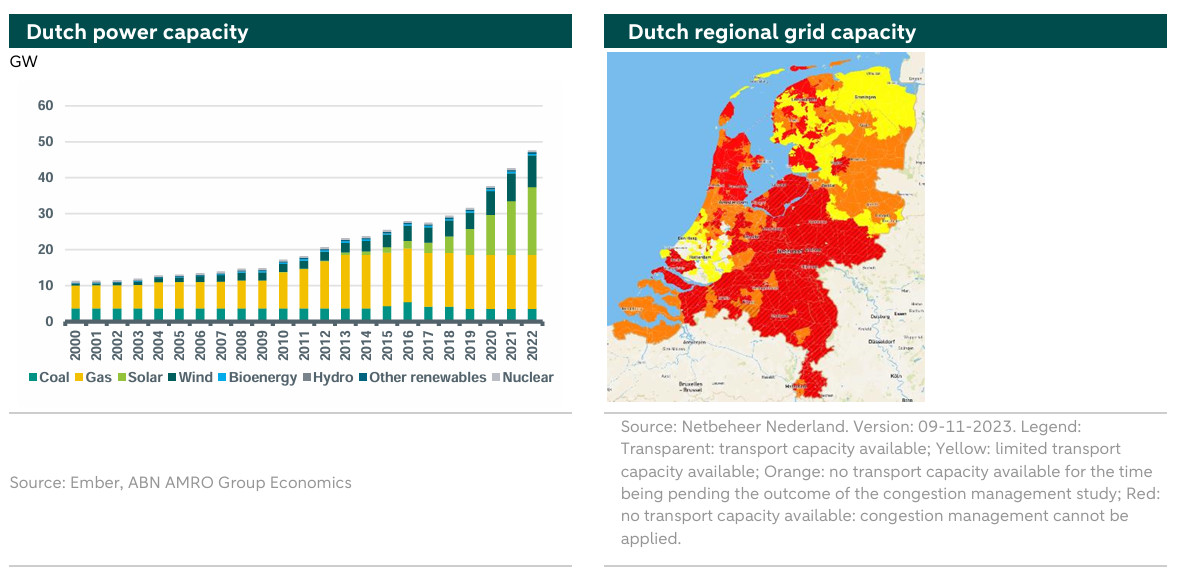
The Netherlands has ambitious transition targets for its power sector with an emission reduction goal of 72% by 2030, compared to 1990 emissions, reaching a carbon-neutral power sector by 2035. To achieve these targets, the Netherlands plans a simultaneous phasing out of conventional fossil-based power production and scaling up of renewable capacity, as can be seen in the left hand chart below. The chart displays the roadmap of the Dutch electricity mix according to the National Plan for Energy (NPE), both for the supply and the demand side. In particular, the Dutch ban on coal guarantees no coal power generation after 2029, marking a major milestone in the Dutch transition. Solar and wind power are the main pillars of the Dutch future energy mix, as illustrated in the charts below. Currently, there is more than 11GW of wind installed capacity in the Netherlands. Solar capacity is more than double that number with 24GW of installed capacity in 2023.

Additionally, under the NPE, the Dutch government set ambitious capacity targets for solar and wind (both onshore and offshore) as shown in the right hand chart above. The chart further emphasizes the role of solar and offshore wind in the future of the power sector in the Netherlands. Meeting the Dutch targets for offshore wind is facilitated by its unique access to the North sea, which has the advantage of relatively shallow waters, strong winds, and the proximity of important ports and energy consumers.
The role of the grid
The energy crisis was a big catalyst to investments in renewables, especially for distributed solar PV. This was most visible in the drastic increase in the solar investments last year. However, the deployment of distributed solar PV at a fast rate with the absence of adequate grid capacity and large scale storage translates into blackouts, curtailments, and negative prices, which discourages investments and slows down the transition process.

Limited grid capacity is usually associated with long permitting and planning times and an old grid network. Additionally, the grid expansion process is complex, which involves many stakeholders (public and private) on a national and regional level, requiring, therefore, coordination at several levels. Moreover, there are long lead times for permitting grid projects because of inefficiency in permitting procedures, along with the extra time needed to adjust and adhere to new regulations. All these issues would make the time needed for grid extension projects almost double the one needed for development of renewable projects, for example. This is an alarming sign: a slower transition due to insufficient grid capacity is magnified because of the mismatch in the timeframe for deploying grid extensions versus that needed for electrification or renewable deployments.
The long lead times also have a financial impact into the viability of renewable projects: a waiting queue makes it challenging for developers to estimate when the project will become operational. This consequently affects their visibility on the timing of future cash flows, which weighs on the rate of return of these projects.
The Dutch limited grid capacity
In large parts of the Netherlands, the electricity grid is so full that no new major consumers, such as companies, can be established in the coming years - until at least either the reinforcements of the electricity grid are ready or more flexible use is made of the net. This issue is demonstrated in the figure below (right), which depicts the regional grid capacity in the Netherlands. This issue has also floated to the surface in many other countries such as the US, Germany, and the UK (1).

The lack of a connection to the electricity grid is an acknowledged problem by many Dutch companies and households with extensive waiting lists all over the country. For example, nearly 10,000 companies are queuing up for new grid capacity, corresponding to tenfold of the electricity demand of the city of Eindhoven, while grid connection problems, on the demand side, are expected to persist until 2035 ().
A similar situation applies to the supply side, namely to the developers of solar parks and wind farms that are essential for the renewable energy transition to succeed in the Netherlands. According to Netbeheer Nederland, the association of Dutch electricity grid operators, there are 7,583 unique requests for a connection for electricity to be fed into the network (). These requests amount to 3.54 GW of additional capacity that can potentially be used for the generation of renewable electricity.
The cost of delay
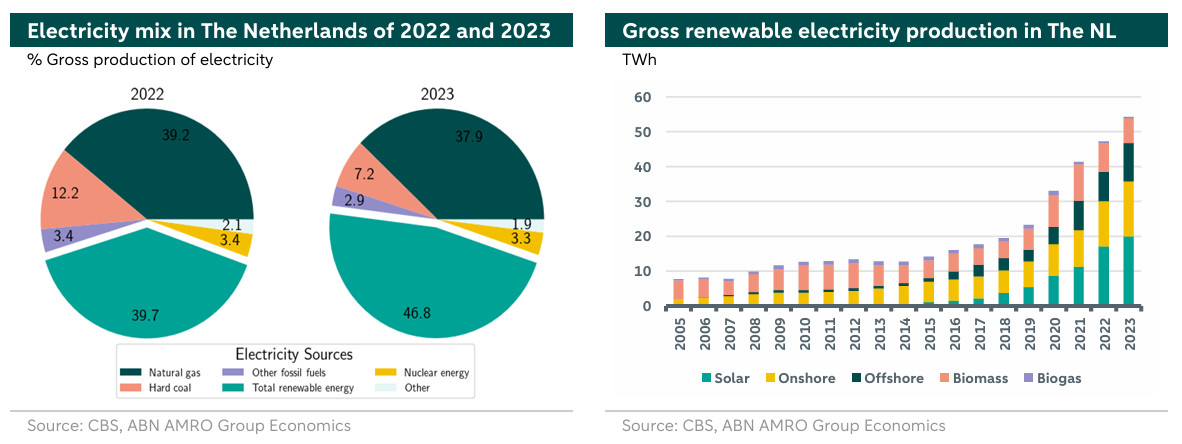
From the data provided by Netbeheer Nederland, we can make a rough estimate of how much additional carbon emission reductions are missed due to the delay in new renewable capacity waiting for a grid connection. Starting with the 3.54 GW of capacity in the waiting queue for feed-in and assuming that these new applications for grid capacity are only due to renewable energies distributed according to the current renewable energy mix, as illustrated in the left hand chart below (2), we can compute the amount of electricity that could be produced with the additional capacity.

To do so, we first, compute how much capacity can be assigned to each technology, i.e. for on-shore, off-shore, and solar, respectively. With these capacities, we can estimate how much electricity can be produced, taking into account the relevant capacity factors. Accordingly, the capacity factors and resulting electricity amounts are given in Table 1.

In total, we find that between 4.84 and 5.54 TWh of electricity could potentially be produced per year if all projects waiting for transport capacity are realized. With these numbers, we can further estimate the emissions that are caused by non-renewable energy sources in the NL, which could be avoided by making use of the additional 3.54 GW of capacity waiting for a grid connection (3). Emission factors () associate a 436 and 970 grams of CO2-equivalents to each kWh of electricity produced by natural gas and hard coal, respectively (4).
In 2023, 37.9% of electricity produced in the NL was due natural gas and 16% were due to hard coal. For now, we assume the additional 3.54 GW of renewable energy capacity would be used to reduce the fossil fuel use according to these proportions. Hence, in total, the Netherlands would have the potential to reduce the yearly emissions by 2.524 to 2.889 Mt CO2 equivalents, which corresponds to 2.16% to 2.47% of the NL’s total emissions of 2023 according to the IEA ().
Alternatively, we can assume that the additional 3.54 GW of capacity for renewables were to be used to phase out of hard coal instead of using the proportions of gas and coal. This scenario seems more realistic, as the Netherlands aims to phase out coal in power generation by 2030, which would reduce more emissions and decrease vulnerability to coal supply chains. Accordingly, with analogous calculations as above, we find that between 4694.8 and 5373.8 Mt of CO2 equivalents could be prevented, which is equivalent to 4.01% to 4.59% of the Netherland’s total emissions of 2023.
Given the current yearly average price of EU ETS allowances of 70 EUR/t CO2 emissions, the yearly emission costs associated to a delay in renewable deployment, would range between 329 and 376 million Euros.
According to the IEA, about only 50% of the capacity in grid connection queues world-wide can be assigned to infrastructure projects at advanced stages (). This fact indicates that the numbers obtained above may overestimate the actual additional electricity generated with a better power grid infrastructure. However, the above considerations illustrate how impactful an accelerated grid expansion might be and should urge policymakers and investors to improve fundamental energy infrastructure.
Conclusion
In this note we highlight the importance of the timely deployment of infrastructure on the transition process and achieving climate goals in a timely and orderly manner. With a focus on the Netherlands, we find that a delay in renewable investments due to limited grid capacity or other factors, like long permitting times or missing regulation, would lead to carbon costs up to EUR 376 million on a yearly basis. This number is however based on current capacity in the queue waiting for a grid connection to feed-in electricity into the power grid without taking into account the possible postponement in electrification across other sectors on the demand side. Including the latter in this consideration may significantly increase the damage caused by grid delays.
1) In the United Kingdom, there are 371 GW of subscribed projects for grid connection, of which only 111-148 are expected to be connected (more ).
2) We only take into account off- and on-shore wind and solar in the energy mix since those are expected to grow significantly. Biomass and Biogas are not expected to become more relevant in the near future.
3) We further assume no curtailment of renewables over the year for this estimation.
4) For reference, the IEA states the average global carbon intensity of electricity production to be 475 g/kWh.
